

Introduction
Every business today collects a lot of information and business data like sales figures, customer choices, feedback etc. But just having data is not sufficient until and unless you can draw out some actionable insights hidden in that data which when used may result in better decision making and profits. This is the spot where we can utilize the behavioural clustering of trends.
Clustering helps us group things that behave or act in similar ways. For instance if we take example of QSR businesses like KFC or Dominos, clustering can be utilised to study the buying behavior of customers by factors like discounts offered, combo deals provided, or may be special offers on that particular day like KFC's Wednesday deals. So, in order to understand what and when to offer and make a lucrative offer to customers so that they may order from your QSR, this plays an important role in the sales and thus influencing the profitability of that branch or that business.
So a gap of behavior analysis came up as we had the data about the business but no insights about the patterns and therefore we chose the traditional way of how we see and identify similar things. The reason we have used Clustering is, if we are able to understand the distribution of the customer base and how they are buying by some questions like if they buy what are the circumstances that may increase or decrease their ticker price or make them choose next they order from you? This answer lies in the clustering. If you can segregate differences in buying behaviour then you can easily design strategies to attract those potential customers or launch brand loyalty schemes to engage customers in a repetitive manner.
This blog post is based on our recent work for a Client who is into QSR business to study behaviour and patterns to improve their operational efficiency, quality and margins.
What is Clustering
Clustering is a technique primarily based on behaviour of grouping similar objects, in mathematically speaking, clustering is a process of grouping a set of objects into clusters so that objects in the same cluster are more similar to each other than to those in other clusters. So, on data analytics or Machine Learning side we categorize clustering mainly based on the following methods.
Centroid-based Clustering
Centroid-based clustering groups data points around a central point or entity called centroids, where each cluster is represented by the mean or median of its members.
Examples: K-Means Clustering, K-Mediod Clustering
# K Means Clustering
from sklearn.cluster import KMeans
from sklearn.metrics import silhouette_score
from sklearn.cluster import KMeans
import matplotlib.pyplot as plt
inertia_values = []
k_range = range(1, 11)
for k in k_range:
kmeans = KMeans(n_clusters=k, random_state=42, n_init=10)
kmeans.fit(features_for_clustering)
inertia_values.append(kmeans.inertia_)
plt.figure(figsize=(10, 6))
plt.plot(k_range, inertia_values, marker='o', linestyle='-')
plt.title('Elbow Method for Optimal k')
plt.xlabel('Number of Clusters (k)')
plt.ylabel('Inertia (Within-cluster sum of squares)')
plt.xticks(k_range)
plt.grid(True)
plt.show()
silhouette_scores = []
k_range_silhouette = range(2, 11)
for k in k_range_silhouette:
kmeans = KMeans(n_clusters=k, random_state=42, n_init=10)
kmeans.fit(features_for_clustering)
cluster_labels = kmeans.predict(features_for_clustering)
silhouette_avg = silhouette_score(features_for_clustering, cluster_labels)
silhouette_scores.append(silhouette_avg)
plt.figure(figsize=(10, 6))
plt.plot(k_range_silhouette, silhouette_scores, marker='o', linestyle='-')
plt.title('Silhouette Score for Optimal k')
plt.xlabel('Number of Clusters (k)')
plt.ylabel('Silhouette Score')
plt.xticks(k_range_silhouette)
plt.grid(True)
plt.show()
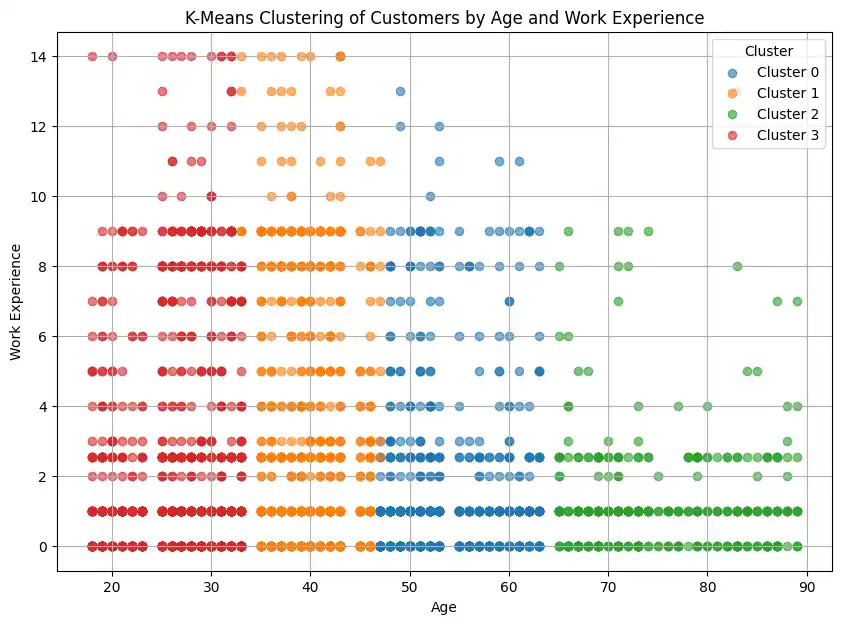
kmeans = KMeans(n_clusters=optimal_k, random_state=42, n_init='auto')
kmeans.fit(features_for_clustering)
cluster_labels = kmeans.predict(features_for_clustering)
df_test['Cluster'] = cluster_labels
if df_test['Work_Experience'].isnull().sum() > 0:
mean_work_experience = df_test['Work_Experience'].mean()
df_test['Work_Experience'].fillna(mean_work_experience, inplace=True)
plt.figure(figsize=(10, 7))
for cluster_id in sorted(df_test['Cluster'].unique()):
cluster_data = df_test[df_test['Cluster'] == cluster_id]
plt.scatter(cluster_data['Age'], cluster_data['Work_Experience'], label=f'Cluster {cluster_id}', alpha=0.6)
plt.title('K-Means Clustering of Customers by Age and Work Experience')
plt.xlabel('Age')
plt.ylabel('Work Experience')
plt.legend(title='Cluster')
plt.show()
pythonHierarchical Clustering
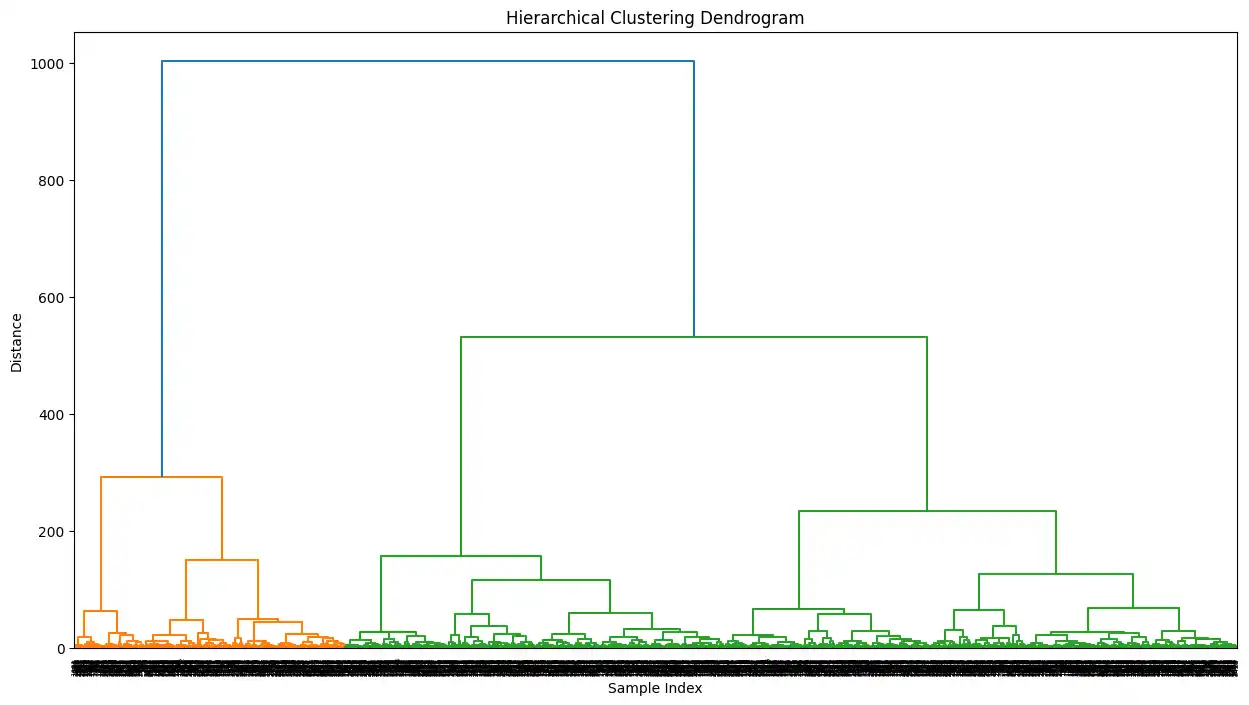
Hierarchical clustering is an unsupervised machine learning technique that groups data points into a tree-like hierarchy of clusters without needing to pre-specify the number of clusters.
# Hierarchical Clustering
from scipy.cluster.hierarchy import linkage
from scipy.cluster.hierarchy import dendrogram
import matplotlib.pyplot as plt
from scipy.cluster.hierarchy import fcluster
distance_metric = 'euclidean'
linkage_method = 'ward'
print(f"Selected distance metric: {distance_metric}")
print(f"Selected linkage method: {linkage_method}")
linkage_matrix = linkage(features_for_clustering, method=linkage_method, metric=distance_metric)
print("Shape of the linkage matrix:", linkage_matrix.shape)
plt.figure(figsize=(15, 8))
dendrogram(linkage_matrix)
plt.title('Hierarchical Clustering Dendrogram')
plt.xlabel('Sample Index')
plt.ylabel('Distance')
plt.show()
optimal_num_clusters_hierarchical = 4
print(f"Based on the dendrogram analysis, the optimal number of clusters is estimated to be: {optimal_num_clusters_hierarchical}")
hierarchical_cluster_labels = fcluster(linkage_matrix, optimal_num_clusters_hierarchical, criterion='maxclust')
df_test['Hierarchical_Cluster'] = hierarchical_cluster_labels
display(df_test.head())
if df_test['Work_Experience'].isnull().sum() > 0:
mean_work_experience = df_test['Work_Experience'].mean()
df_test['Work_Experience'].fillna(mean_work_experience, inplace=True)
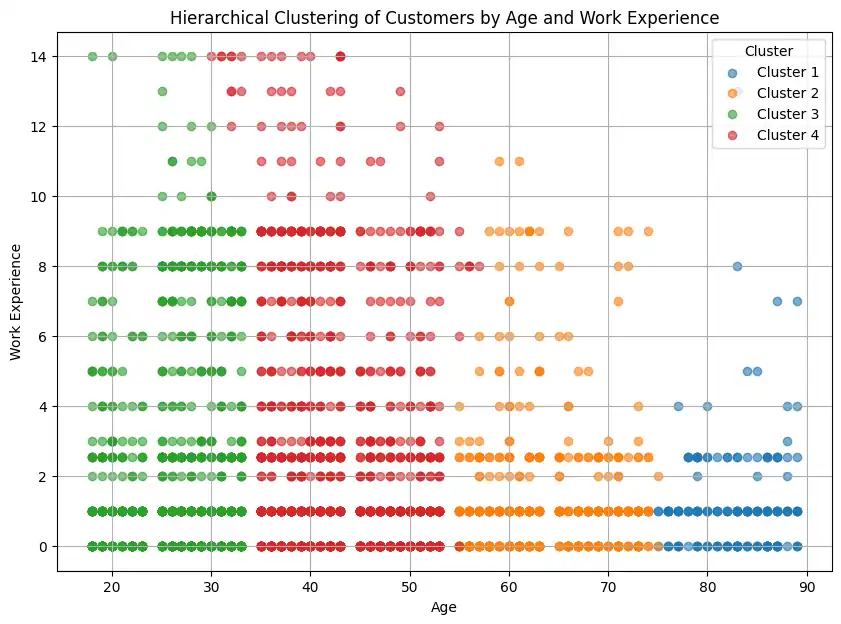
plt.figure(figsize=(10, 7))
unique_hierarchical_labels = sorted(df_test['Hierarchical_Cluster'].unique())
for cluster_id in unique_hierarchical_labels:
cluster_data = df_test[df_test['Hierarchical_Cluster'] == cluster_id]
plt.scatter(cluster_data['Age'], cluster_data['Work_Experience'], label=f'Cluster {cluster_id}', alpha=0.6)
plt.title('Hierarchical Clustering of Customers by Age and Work Experience')
plt.xlabel('Age')
plt.ylabel('Work Experience')
plt.legend(title='Cluster')
plt.grid(True)
plt.show()
pythonUses of Clustering
Clustering can be used in various real world applications such as:
- Customer Segmentation: Grouping customers based on behavior or demographics for targeted marketing strategies.
- Anomaly Detection: Identifying suspicious or fraudulent activities in finance, network security and sensor data.
- Image Segmentation: Segregating images into groups for object detection, medical diagnostics or computer vision tasks.
- Recommendation Systems: Recognizing user preferences to recommend movies, products or content tailored to different groups.
Our Solution: How did we use Clustering?
Our goal was to provide an in-depth insight of the trends, behaviours and factors of customers buying behaviour. These patterns were very crucial as they would influence the revenue and marketing decisions.
So clustering was used as it groups or clusters data without labels and can be used to provide with naturally occurring clusters in the input data . The reason was the data was flowing from real world platforms like Swiggy, Zomato and more. We had to create a solution which provided us with:
- Exploratory data analysis (EDA) as the data was unlabeled.
- Scales easily with amount of input data.
- To understand the patterns and provide insights automatically.
Data Sourcing and Pre-processing
The data for the clustering came from various internal and external sources. We ingested business's sales records and order information from partner platforms like Swiggy, Zomato or from marketing or ad campaigns. We implemented data scraping and pipelines to ingest these data on regular basis and created a data lake. The collected data was preprocessed for clustering by:
- Removing null values or duplicates
- Segregating numerical data and categorical data
- Outlier were detected on data and ignored
Self-service for Analysis
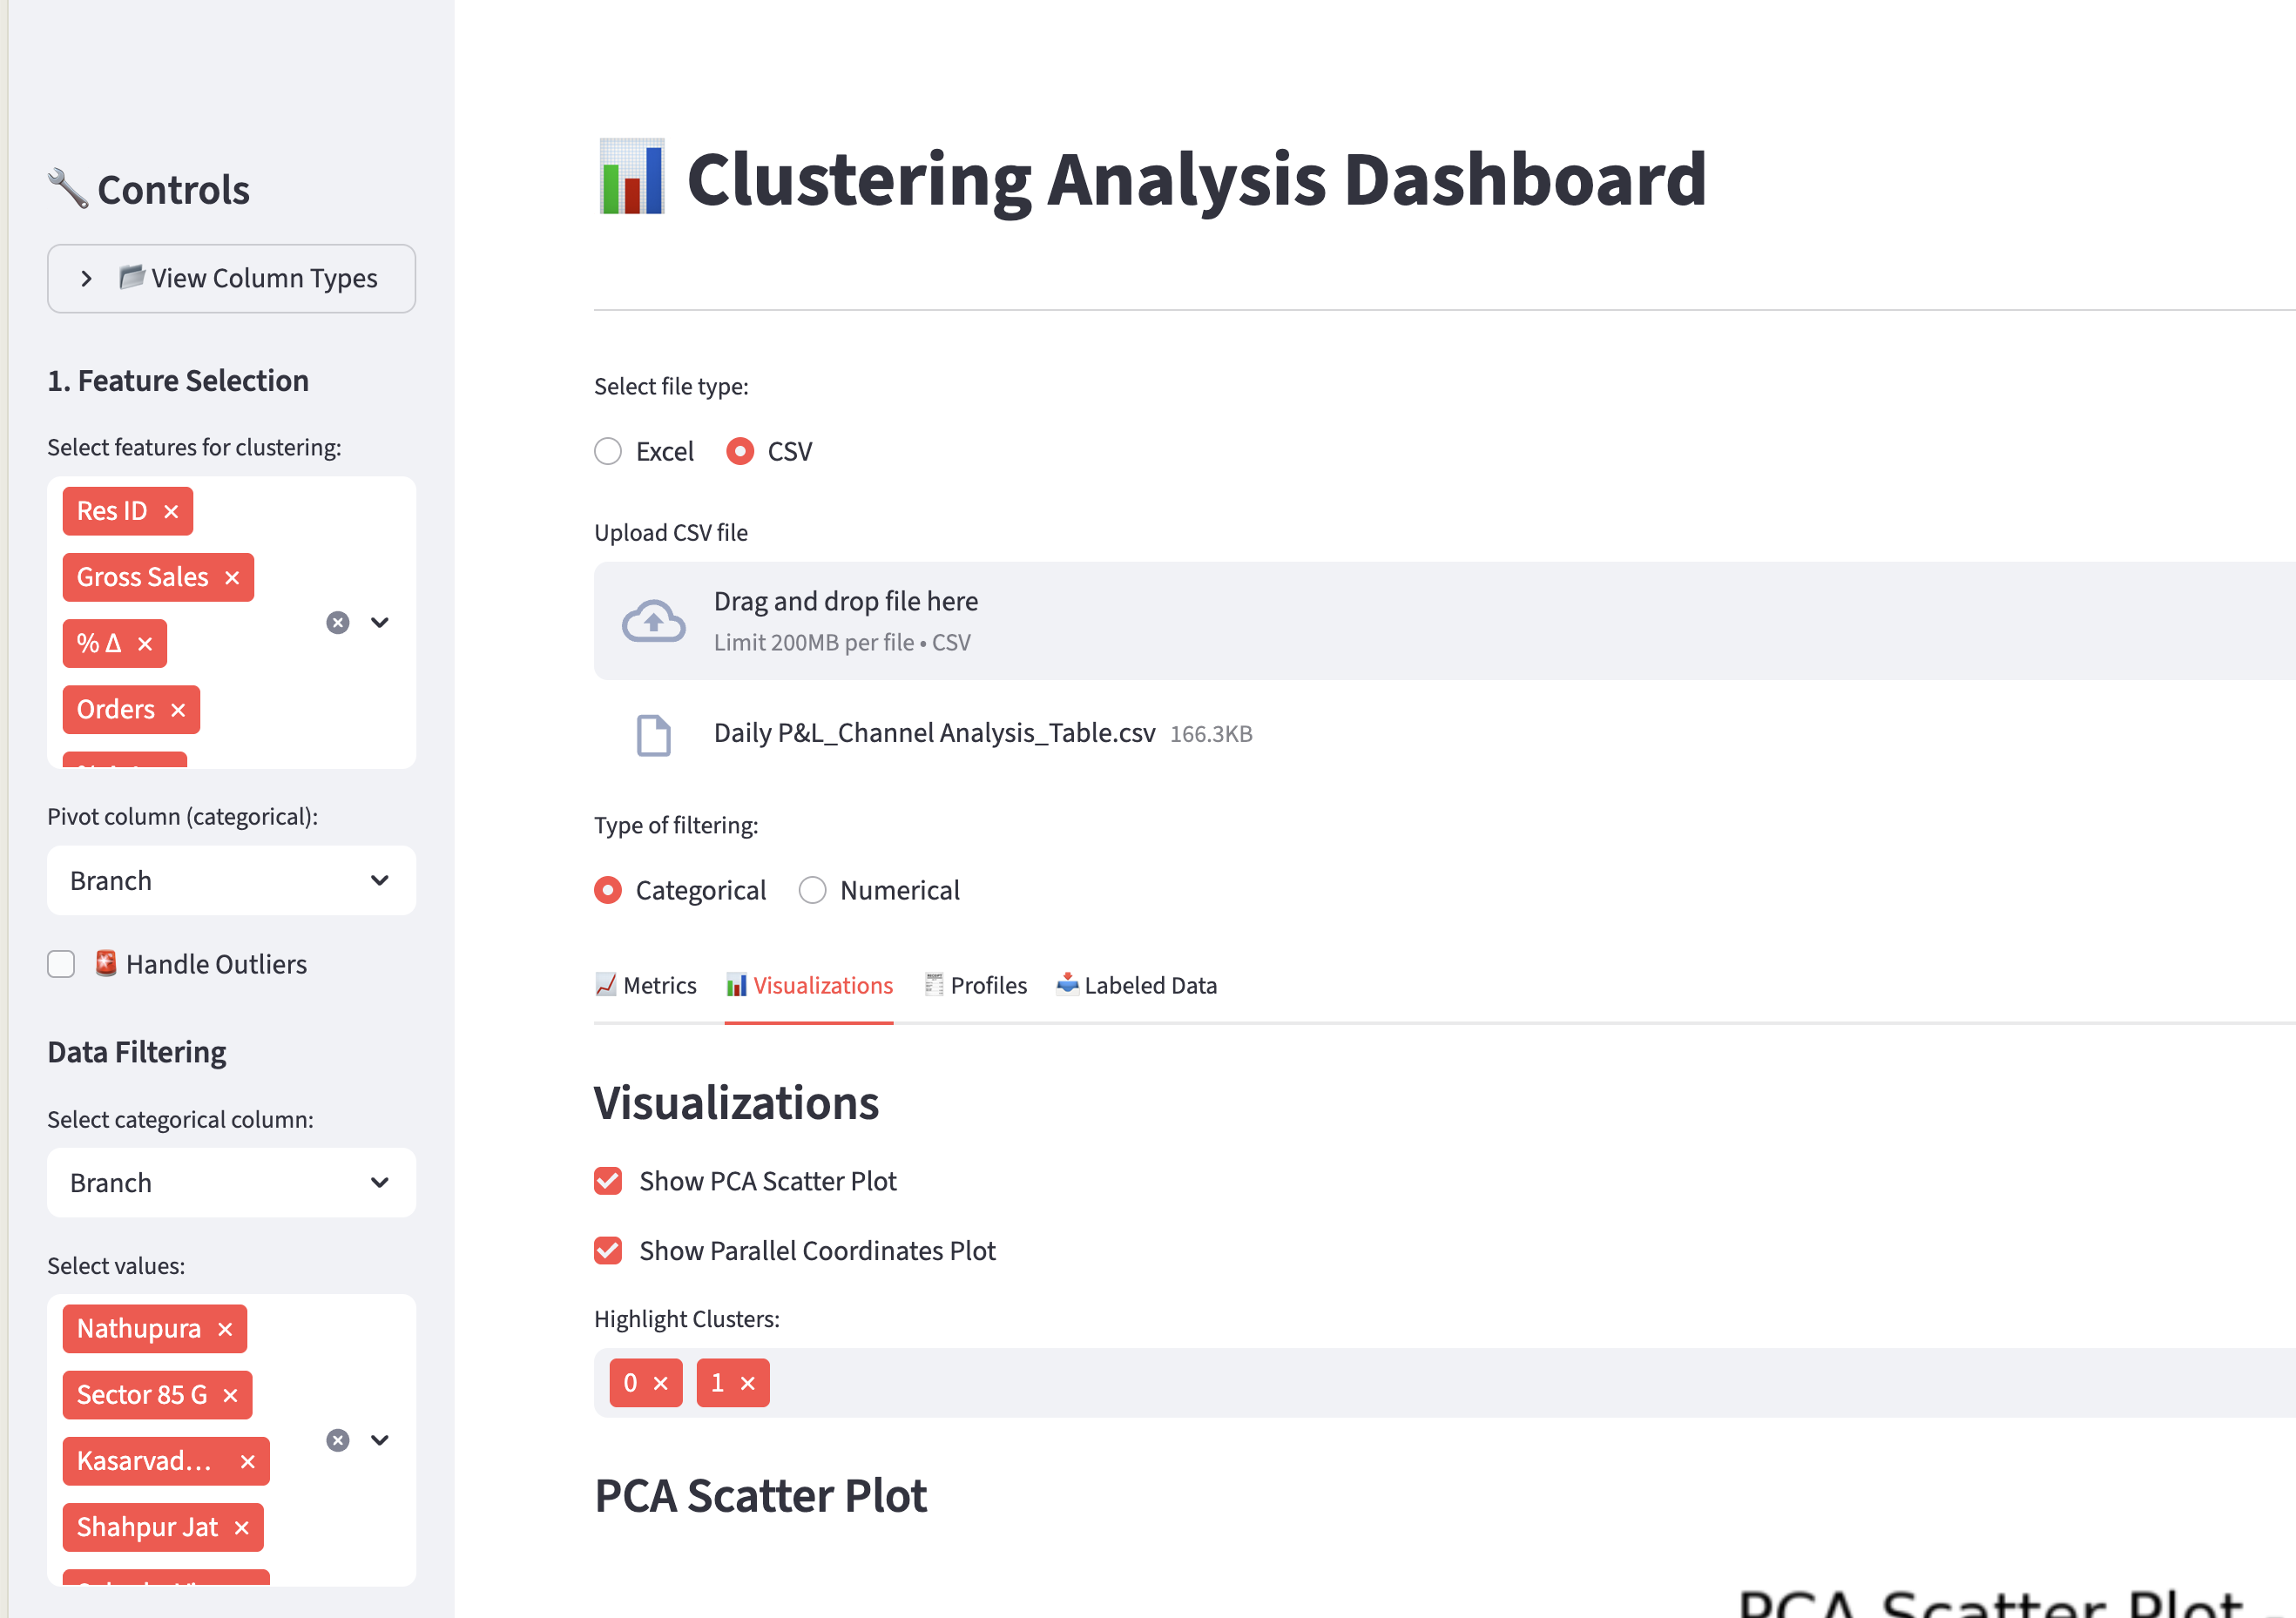
We created an self-service application using Streamlit for business analyst and decision makers. The app allows user to filter based on various business parameters. The preprocessed data is passed into algorithms like K means clustering, Gaussian Mixture Models, then to make sure all naturally occurring clusters are highlighted, an auto rank functionality is being offered which uses elbow method to find the most optimal and distinct naturally occurring clusters based on silhouette score. This has helped the customer to make better decisions in less time.
Visualizing Cluster behaviour across multiple dimensions
Scatter plots are descriptive and help to visualize the distinctiveness of clusters, but when we need to study trends or behavioural analysis we need to compare the behavior of clusters across multiple dimensions simultaneously. This can be easily achieved using Parallel Coordinates Plot.
import pandas as pd
import plotly.express as px


numerical_cols_for_parallel_plot = ['Age', 'Work_Experience', 'Family_Size']
available_cols = [col for col in numerical_cols_for_parallel_plot if col in df_test.columns]
available_cols.append('Cluster')


df_parallel_plot = df_test[available_cols]
fig = px.parallel_coordinates(df_parallel_plot, color="Cluster",
                             dimensions=available_cols[:-1],
                             title="Parallel Coordinate Plot of K-Means Clusters")


fig.show()
python
How to read Parallel Coordinate Plot
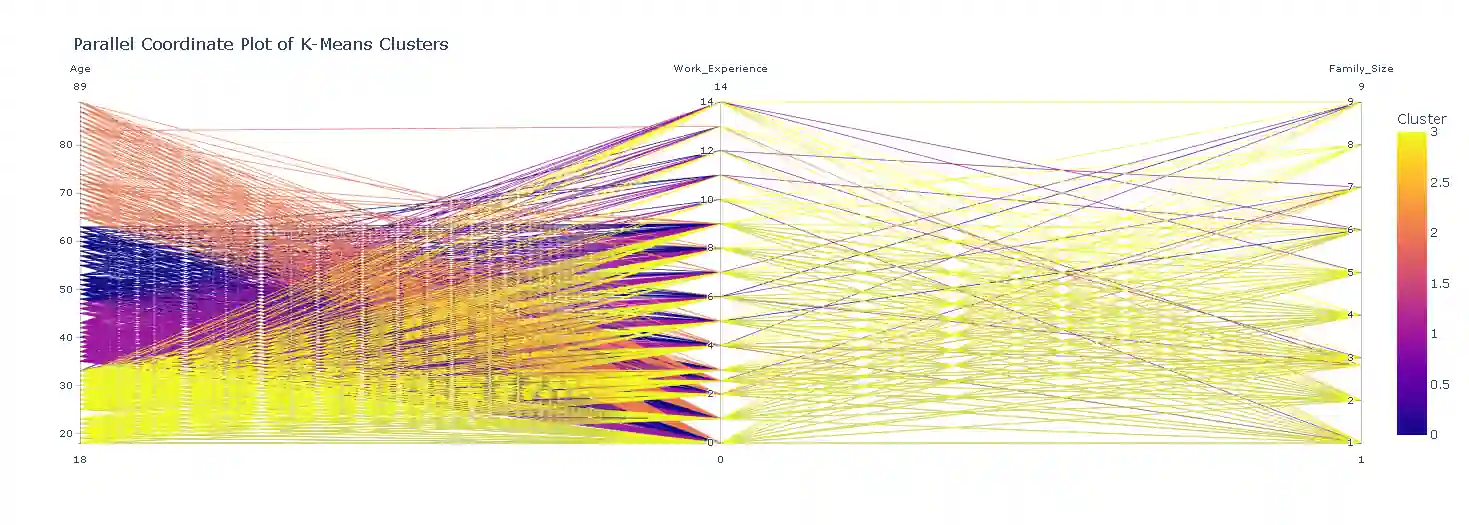
Each line represents a customer (or data point), and colors show which cluster they belong to. This helps you quickly see which group has higher income, more experience, or different spending patterns.
Outcomes of Clustering Solution
After applying clustering, we observed some actionable insights that are used by Customer's analytics team.
- Customer Segmentation: Using sales data, we came up with some clusters like:
- High Frequency, High Value customers which represented trustful and loyal buyer and we can offer them loyalty rewards
- High Value, High Discount seekers these customers usually buy when they see lucrative deals or decent discounts.
- Menu Design: Using order data, we could design a more demanding menu having combinations specific to the pattern of that store.
- Operations Optimization: Using data from operations we can plan the store’s staff and raw materials efficiently based on sudden rise or falls for example during occasions etc.
Conclusion: Turning Data into Decisions—and Profits
Data is no longer just a byproduct of operations—it's a strategic asset. But raw data alone doesn't drive growth; actionable insights do. As demonstrated in our work above, clustering techniques unlocked hidden patterns in customer behavior, enabling smarter marketing, optimized operations, and more profitable decision-making.
The real breakthrough, however, came not just from the analytics—but from democratizing access to those insights. By building a self-service application powered by data science, we eliminated the traditional bottlenecks between data teams and business stakeholders. Marketing managers, store operators, and executives can now explore customer segments, test hypotheses, and respond to trends in real time—without waiting weeks for reports or relying on technical intermediaries.
This shift has dramatically reduced time-to-insight and accelerated time-to-value. Strategies that once took months to formulate can now be validated and deployed in days. Loyalty programs are tailored to actual behavioral clusters, menus reflect real demand patterns, and staffing aligns with predictive footfall—all contributing to higher margins, improved customer retention, and increased revenue.
Data science isn't just about algorithms—it's about enabling better decisions at speed and scale. When businesses embed these capabilities into intuitive, self-service tools, they transform data from a static resource into a dynamic engine for growth.
If your organization is sitting on mountains of data but struggling to extract meaningful value, it's time to think beyond dashboards and reports. Leverage clustering, build self-service intelligence, and turn your data into your most powerful competitive advantage.
Because in the end, the goal isn't just to understand your customers—it's to serve them better, faster, and more profitably than ever before. Engage us to discuss how we can help your business.
We also want to thank the Client's analytics and business team to help us understand their business and relationship in the data.


