Monitoring is the lifeline that ensures the seamless operation of systems, applications, and networks. Whether managing a small startup or a large enterprise, the ability to monitor infrastructure in real time is crucial for maintaining performance, ensuring reliability, and quickly resolving issues before they escalate. The average cost of downtime in IT industry as per Pingdom is between $5600 to $9600 per minute and as more and more digitization happens, it is going to increase further.
Prometheus is an open-source monitoring and alerting system that can be installed as a standalone server or within Kubernetes. Prometheus is a de facto standard for storing and querying metrics, and other popular observability projects such as Thanos and VictoriaMetrics which is used to store metrics for long term while reducing cost. These projects also support PromQL as a query language. In this blog, we will explore how Prometheus can enhance monitoring and delve into PromQL.
Introduction to Prometheus
Prometheus, an open-source time-series database (TSDB), was originally developed by SoundCloud in 2012. It has since become a cornerstone of monitoring solutions for businesses of various sizes and is a graduated project under the Cloud Native Computing Foundation (CNCF). Prometheus operates as a standalone server or process that collects metrics from applications or specified targets, typically retrieving data from the /metrics endpoint by default.
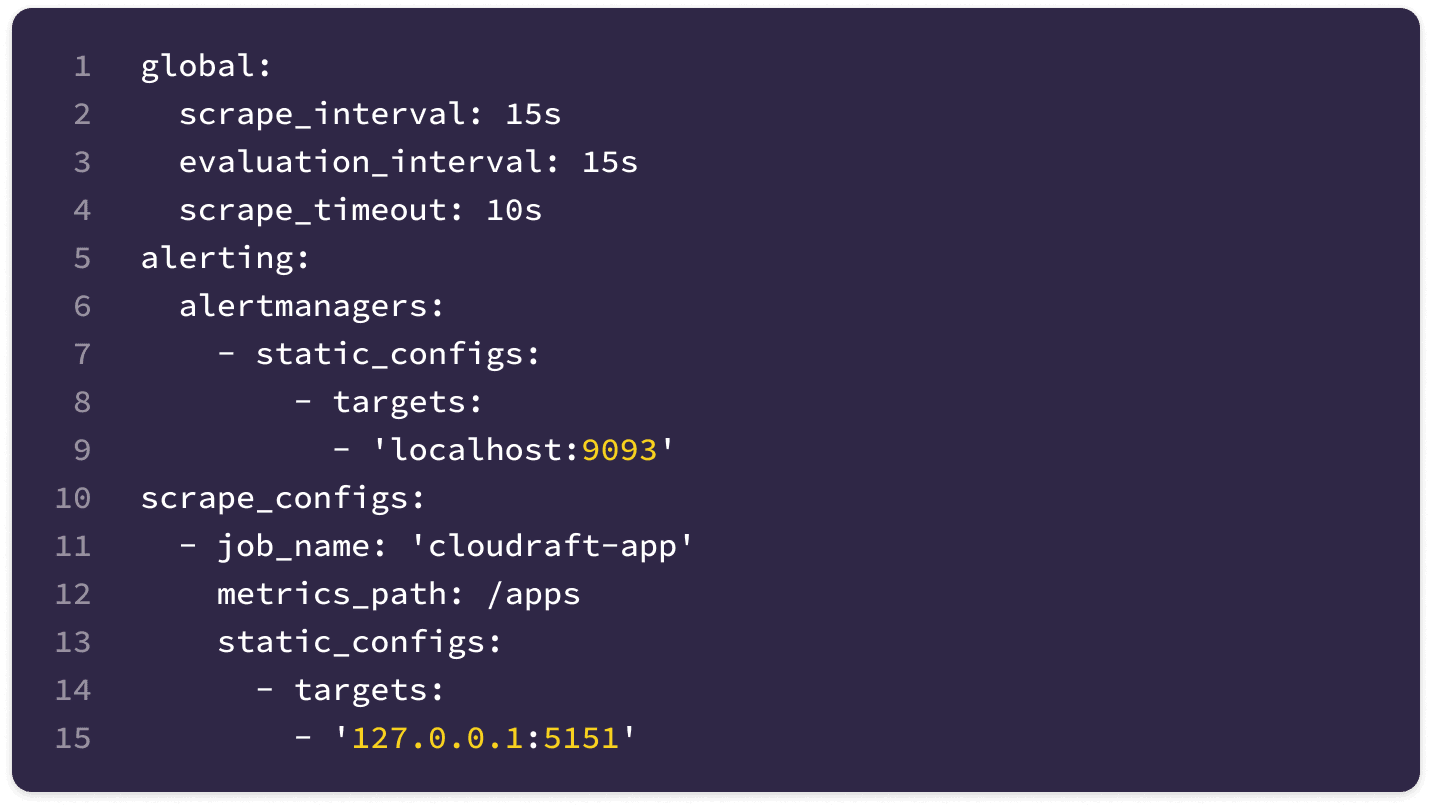
To configure Prometheus, the targets from which metrics will be collected must be specified in the prometheus.yaml file. The collected metrics are stored as time-series data, which is timestamped according to Unix time. Prometheus exposes an endpoint on port 9090, providing access to a Prometheus dashboard where users can query these metrics. The query language used by Prometheus for this purpose is PromQL.
Architecture of Prometheus

Some of the main components in monitoring using Prometheus are as follows:
- Push Gateway
- Alert Manager
- Custom Exporter
- Visualisation tools
Push Gateway
Using the Pushgateway, we can configure a push-based mechanism in Prometheus. In this setup, different targets or jobs push metrics to a Pushgateway instance, and Prometheus then uses a pull-based mechanism to retrieve these metrics from the Pushgateway. This approach is particularly useful for short-lived batch jobs, as it does not require synchronisation with Prometheus scrape interval.
However, the Pushgateway should only be used for specific scenarios like batch jobs. Relying on a single instance of the Pushgateway can create a single point of failure if it goes down.
Alert Manager
Whenever an issue arises, it is crucial to receive timely notifications. The Prometheus Alertmanager excels in this aspect, providing reliable alerts and seamlessly integrating with numerous third-party tools. Its versatility and compatibility make it an indispensable asset for effective monitoring and incident management. Follow the below setups to configure the alert manager.
- Client Configuration: The Alertmanager needs to be configured with a client. In this case, the client is a Prometheus server.
- Alerting Rules: After configuring the client, we need to set up alerting rules to receive alerts based on specific criteria. For example, we can create a rule to get notified when CPU utilization exceeds 85%.
- Integration: It's important to integrate third-party tools where we want to receive your notifications. The Alertmanager can send notifications to popular platforms such as Pagerduty, Slack, and more.
Custom exporter
We can use a custom exporter to send custom metrics from our application. This can be achieved by using the standard libraries provided by Prometheus. For more information, check.
Visualization tool
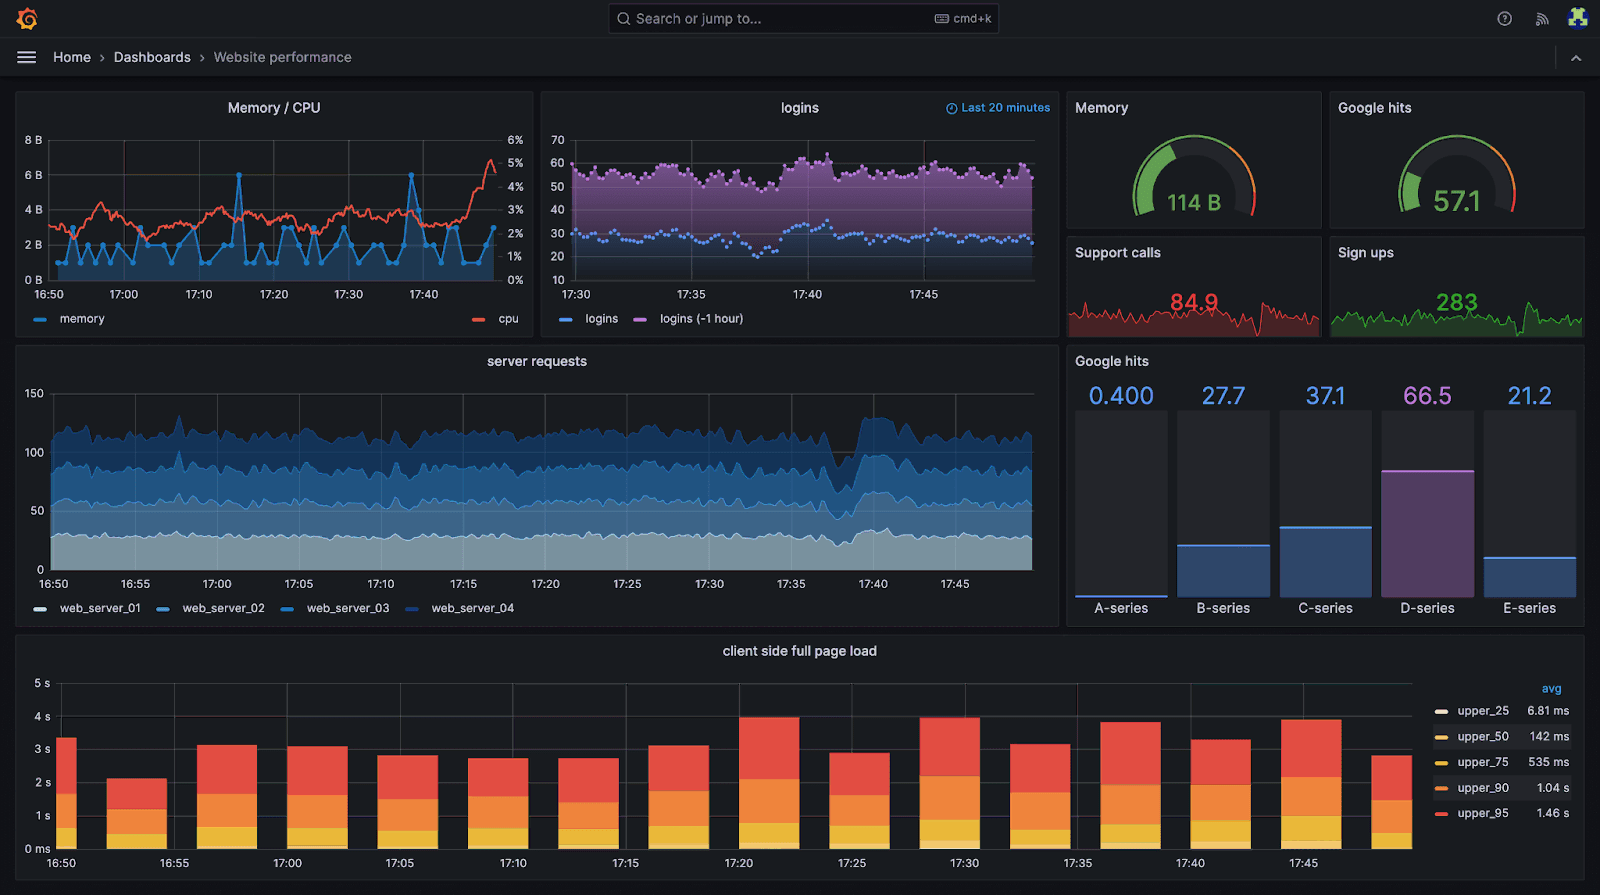
We can use visualization tools like Grafana to query the Prometheus server. Grafana allows us to create graphs to visualize these metrics, providing a better understanding of the internal workings of our system. Additionally, Grafana can be used to configure alerting rules in the Alertmanager, enhancing our monitoring and alerting capabilities. We can also use the Prometheus dashboard to see the metrics.

Prometheus Installation
Before starting let's download Prometheus on our local system using the below script. This script will run the Prometheus instance at port 0.0.0.0:9090 by default.
wget https://github.com/prometheus/prometheus/releases/download/v2.53.0/prometheus-2.53.0.linux-amd64.tar.gz
tar xvf prometheus-2.53.0.linux-amd64.tar.gz && cd prometheus-2.53.0.linux-amd64/ && ./prometheus
bash
At a high level Prometheus Server will do the following:
- Pull metrics from a target
- Store metrics in TSDB
- Expose endpoint to query the metrics

To understand Prometheus better, we need to see the below components.
- Prometheus configuration file
- Metrics
- TSDB
- PromQL
Prometheus Configuration
Prometheus scrapes only the targets specified in its configuration file prometheus.yml. If you've executed the above script, you should have generated a prometheus.yml file. To expand the list of targets for scraping, follow these steps to modify your configuration file and restart the Prometheus instance to apply the changes.
Prometheus will monitor all targets defined in the scrape configuration section of this file.

To automatically detect monitoring targets, we can leverage Prometheus Service Discovery. This crucial feature enables the automatic detection and monitoring of targets in dynamic environments, eliminating the need for manual configuration. Service Discovery allows Prometheus to adapt to infrastructure changes in real time, ensuring comprehensive and up-to-date monitoring.

By following this configuration, we can harness the power of Service Discovery to streamline your monitoring process and maintain accurate oversight of your dynamic infrastructure.
Metrics
When querying the Prometheus server using PromQL(Prometheus Query Language), we retrieve metrics of various types. In the example below, we are querying the number of pods per node, which returns a value of 1542.

Below are different types of metrics:
- Counter: It is used to count resources. It will always increase and never decrease.
- Gauge: It will also count resources but its value can increase or decrease. Example CPU or RAM consumption.
- Histogram: It tells us what happened in a given time frame. This time frame is known as bucket size. It also provides a sum of all observed values.
- Summary: It is similar to a histogram but the results are in percentage.
PromQL
Below are 4 types of PromQL operation:
- Range Vector: It is a set of time series containing a range of data points over time for each time series. In the example below, we specify a time range of 15 minutes, which retrieves all the data from the past 15 minutes.
node_pod_numbers[15m]
plain- Instant Vector: It contains samples within each time series, all sharing the same timestamp. In the example below, we are determining the number of pods on different instances at the same time.
node_pod_numbers{instance = "cloudraft-1"} 524   3rd July 11:16 PM
node_pod_numbers{instance = "cloudraft-2"} 181   3rd July 11:16 PM
node_pod_numbers{instance = "cloudraft-3"} 718   3rd July 11:16 PM
node_pod_numbers{instance = "cloudraft-4"} 2434  3rd July 11:16 PM
plain-
Scalar: It is a simple
float64value obtained when querying the Prometheus server. -
String: It is a string value that is currently not in use.
Modifier
Using modifiers we can get historical data from Prometheus. We can also use Unix timestamp to specify the time.
node_pod_numbers{instance = "cloudraft-1"} offset 10min
node_pod_numbers{instance = "cloudraft-1"} @1709425346
plain
Operator
Using PromQL we can perform various operations. Below are some examples
- Arithmetic Operations.
node_pod_numbers{instance = "cloudraft-1"} + 2434
plain- Comparison Operations.
node_pod_numbers{instance="cloudraft-1"} > node_pod_numbers{instance="cloudraft-2"}
plain- Logical Operations
(node_pod_numbers{instance="cloudraft-1"} > node_pod_numbers{instance="cloudraft-2"})
and
(node_pod_numbers{instance="cloudraft-3"} == node_pod_numbers{instance="cloudraft-4"})
plain
Aggregation
We can use aggregation to aggregate our data. Below is an example
(sum(node_pod_numbers) by (instance) > 50)
and
(sum(node_pod_numbers{instance="cloudraft-3"}) by (instance) == 30)
plain
For more check Prometheus Docs
Conclusion
Prometheus is an ideal choice for small to medium-sized applications generating thousands of metrics. However, for large-scale applications, a single instance of Prometheus may not be able to scrape and handle the extensive volume of metrics. To address this issue, we can use Thanos to scale Prometheus horizontally. For more information on Thanos, subscribe to our newsletter to get an update on the upcoming post.
Subscribe to our newsletter to stay tuned for the latest updates and insights in monitoring and scaling solutions! Also, if you are looking for help in Prometheus or Thanos, feel free to engage us.
See the Unseen and Reduce MTTR
Reduce blindspots, get a full stack observability and fix problems faster. Our observability experts are ready to help.


