GPU Observability Consulting
GPU observability for AI factories and neoclouds
Find what is slowing your GPU cloud before your customers do. One view across GPUs, fabric, power and every tenant.
Who we work with
- AI factories
- Neoclouds
- AI clouds
- Inference platforms
- Sovereign AI clouds
Trusted by leading organizations


















What breaks in a GPU fleet
- 01
Allocated is not busy
nvidia-smi shows 100% if any kernel ran. SM and tensor core activity show the real work.
The cost: Pricing and capacity plans rest on the wrong number.
- 02
Power and heat cap performance quietly
Throttling and power capping slow GPUs without an alert. Large training jobs swing rack power in step.
The cost: You pay for compute you never deliver, and racks run near their limits.
- 03
One slow link stalls the whole job
A flapping InfiniBand port, a downtrained PCIe link or a storage stall creates a straggler.
The cost: Every GPU in the job waits, and the customer notices first.
- 04
Hardware errors arrive without context
Xid, ECC and row-remap events land as log noise, not tied to a job or tenant.
The cost: The same faults get triaged by hand, and RMA calls rest on guesswork.
- 05
No usage numbers per tenant
Metrics describe hardware, not customers. GPU-hours used per tenant or MIG slice get rebuilt by hand.
The cost: SLA credits, billing disputes and nothing to show customers.
- 06
Monitoring that breaks as you grow
Per-GPU, per-tenant labels explode metric cardinality. One Prometheus or per-host pricing stops scaling.
The cost: You lose visibility just as the fleet grows.
What GPU observability covers in an AI factory
Five layers, from the building to the customer. Every signal carries its rack, node, job and tenant.
- 01
Facility
- Power draw vs limit
- PDU and PSU health
- Inlet temperature
- Cooling
- 02
GPU and memory
- SM and tensor core activity
- HBM usage and bandwidth
- Clock throttle reasons
- Xid, ECC, row remaps
- MIG slices
- 03
Host and interconnect
- PCIe bandwidth and AER
- Link width and speed
- NVLink errors
- InfiniBand / RoCE health
- Storage I/O
- 04
Orchestration
- Kubernetes and Slurm
- Queue wait time
- Idle allocations
- Pod and job mapping
- 05
Tenant and workload
- GPU-hours allocated vs active
- Throughput and step time
- Inference latency
- SLA status
Our engineers work inside your team
- 01
In your clusters and on your incidents
Our engineers work in your repos and join your incident reviews. Fixes land in production.
- 02
Every incident closes a gap
Each slowdown we trace becomes an alert, a dashboard or a runbook. The next one surfaces sooner.
- 03
Your team owns it when we leave
Dashboards, alerts and runbooks stay with your SREs. We stay on call if you want us.
From blind spots to one view of the fleet
- 01
Assess
We map what each team sees today, and where incidents go dark.
- 02
Instrument
GPU, host, fabric and facility signals, each tagged with rack, job and tenant.
- 03
Correlate
Alerts on what customers feel, traced to the layer that caused it.
- 04
Hand over
Tenant dashboards, SLA reports and runbooks your team runs.
“CloudRaft have carved out a niche and established themselves as leaders in Observability consulting.”
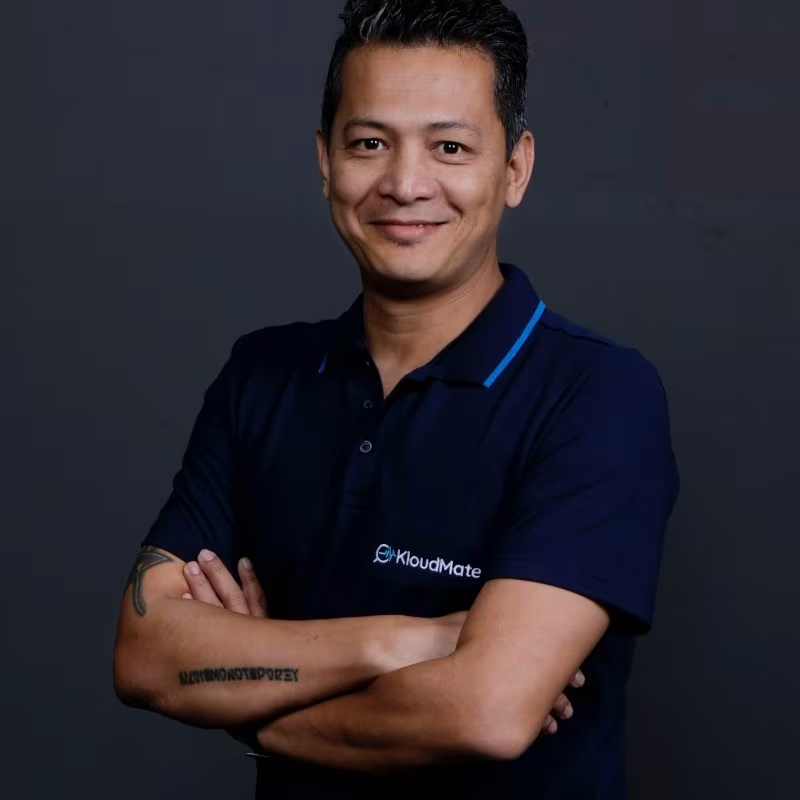
Pranab Buragohain
CEO, KloudMate
Case study · AI cloud for a data center
We built a multi-tenant GPU cloud on Kubernetes for a data center in India.
Read the case studyVendor-neutral, built on open standards
We work with the tools you already run. NVIDIA or AMD, Kubernetes or Slurm, open source or commercial.
- NVIDIA DCGM
- AMD Instinct
- Kubernetes
- Prometheus
- Thanos
- VictoriaMetrics
- Grafana
- OpenTelemetry
Who is this for?
Neoclouds and GPU clouds
- You rent GPUs as bare metal, VMs or Kubernetes
- Many tenants share one fleet
- Customers ask for SLAs and usage data
Where we start: We close the gaps where customers would spot problems before you do.
AI factories and sovereign AI clouds
- You run the facility, racks and platform
- Facility and IT teams use separate tools
- Customers or regulators expect audit-ready evidence
Where we start: We connect facility, hardware and platform signals in one view.
Planning a new one? Read how to build an AI cloud.
Inference platforms and AI clouds
- You serve models on owned or rented GPUs
- Latency SLOs and cost per token drive margin
- GPU spend is your largest cost
Where we start: We show how much GPU spend becomes served tokens, and where the rest goes.
GPU and AI infrastructure we have built

Building AI Cloud for India
Discover how CloudRaft helped a datacenter build an AI cloud platform using cloud native technologies improving scalability, cost-effectiveness, and performance.
Read Case Study →
Optimization of AI Spoofing Platform on GCP
We supported an AI startup in overcoming scaling challenges with container optimization, multithreading, and performance tuning with 5x improvements.
Read Case Study →- Read the guide
Guide
How to build an AI cloud
Infrastructure, orchestration and a reference architecture for a GPU cloud.
GPU observability FAQ
GPU observability review
Find the blind spots in your GPU cloud
Talk to a CloudRaft engineer about your fleet and what your monitoring cannot tell you today.
What happens next
- 1
Tell us about your fleet
Your GPUs, tenants and current monitoring.
- 2
We find the blind spots together
Where customers could hit problems you would not see.
- 3
You leave with a clear next step
What to fix first, and what it is worth.