TL;DR
- OpenTelemetry eBPF Instrumentation (OBI) reached its first stable release, 1.0, at the end of October 2026. A single agent per node watches the applications from the kernel and turns their requests into traces: no code, no annotations, no restarts.
- Tracing stops being a favour asked of every development team and becomes something the platform team can switch on by itself. Start scripts and other operators do not get in the way.
- The catch is the kernel. On nodes with kernel lockdown, which Secure Boot usually switches on, OBI turns context propagation off, so one request becomes two traces. Over HTTPS, the trace context only carries between services that OBI itself instruments.
- Check your nodes first. Use eBPF to get every service on the map, and the SDK where end-to-end traces and business context really matter.
Every platform team I know has the same slide in its observability roadmap: "Distributed tracing for all services." And every one of them has watched that line slip, quarter after quarter.
Not because tracing is hard to run. The observability backend is the easy part: a collector, Tempo or Jaeger, a Grafana datasource, done in a week. The hard part is the last mile, the instrumentation. Somebody has to get the instrumentation into every service, and that somebody is usually not on the platform team.
In this blog post, we show how to achieve distributed tracing auto-instrumentation with eBPF. This approach was introduced recently and improves on the auto-instrumentation you may already know; we have written about that earlier approach in our blog. The previous method injected the tracing library automatically at runtime.
Why tracing stalls: the backend is ready, the services are not
I have been working on an observability platform for a payments company. Metrics and logs came together quickly, because they can be collected from the outside: node exporters, log shippers, database exporters. None of that needs a developer to change anything.
Traces were different. The backend was ready, the pipeline was tested end to end, alerts were in place. And the number of services sending traces stayed at zero.
The reason was not resistance, exactly. The development teams were busy shipping features, and from where they sat, tracing was a request from another team that came with a list of chores:
- add an annotation to the Deployment, and roll it out
- check that the start script does not overwrite
NODE_OPTIONS, or the agent silently disappears - if the service is deployed by another operator, find out how to pass pod annotations through it
- restart again whenever the tracing configuration changes
None of these is difficult. Together, multiplied across dozens of services and several teams, they are exactly the kind of work that never reaches the top of a sprint. I suspect this is the most common reason tracing programmes stall: the platform team wants the data, and the people who would have to switch it on have other priorities.
So the interesting question was not "how do we instrument better?" It was "can we get traces without asking the developers for anything?"
Two kinds of zero-code tracing: SDK vs eBPF
The usual answer to "zero-code tracing" is auto-instrumentation through the OpenTelemetry Operator. It is genuinely good. You create an Instrumentation resource, add an annotation, and a webhook injects the language agent into the pod at start-up. No code changes.
But "no code changes" is not the same as "no changes". The agent still lives inside the application process. It is loaded when the process starts, it depends on how the process is started, and it is switched on through the application's own Deployment. Every one of the chores above comes from that.
eBPF-based instrumentation takes a different route. Instead of loading anything into the application, a single agent per node watches the applications from the kernel. It sees HTTP requests, gRPC calls, SQL queries and Kafka messages as they cross the network or system-call boundary, and turns them into spans and metrics. The application is not touched at all: not its image, not its start-up, not its Deployment.
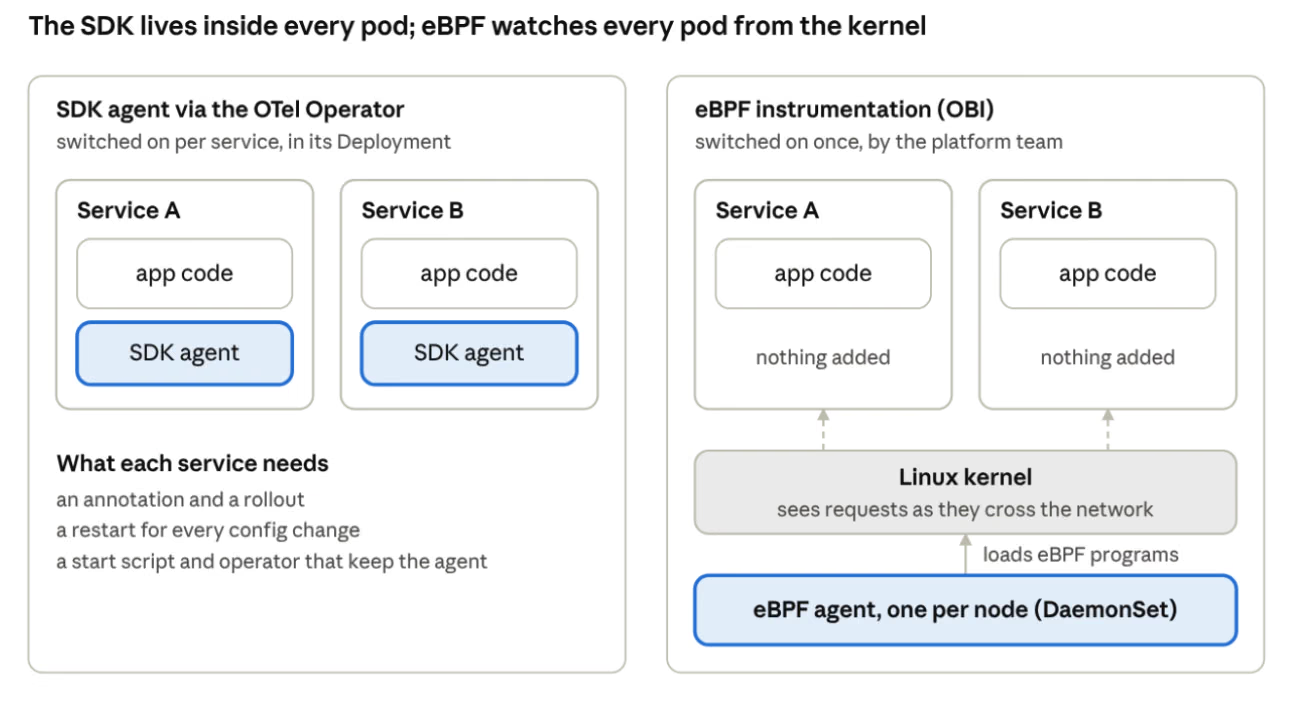
The OpenTelemetry project now has its own implementation of this, OpenTelemetry eBPF Instrumentation (OBI), donated by Grafana Labs from its Beyla project, and it reached its first stable release at the end of October 2026. A stable, vendor-neutral, OTLP-native eBPF agent was what I had been waiting for before trying this approach seriously.
There is a second reason eBPF is interesting, beyond adoption. Because it observes from the kernel, it can see things an in-process SDK never could: network flows between pods and services, calls from languages that have no good SDK, binaries you cannot rebuild, and third-party software you do not own. The wider eBPF ecosystem goes further still, into disk I/O latency, scheduler delays and TCP retransmits. An SDK sees what the application tells it. eBPF sees what the application does.
Five questions that decide adoption
I set up a small test to answer the questions that actually blocked adoption:
- Can a service be traced with no change to its image, start script or Deployment?
- Does it need an application restart?
- Does it survive a start script that overwrites
NODE_OPTIONS, the case that silently breaks the SDK agent? - Does it work for a service deployed by another operator that reverts any change to its Deployment?
- Do the traces connect across services, so one request is one trace?
How to deploy OBI as a DaemonSet (configuration example)
OBI runs as a DaemonSet. The configuration says which workloads to watch, turns on context propagation, and points at an OTLP endpoint:
discovery:
  instrument:
    - k8s_namespace: ebpf-poc
ebpf:
  # Off by default: without it, each hop is a separate trace.
  context_propagation: all
attributes:
  kubernetes:
    enable: true
otel_traces_export:
  endpoint: http://jaeger.obi.svc.cluster.local:4318
  protocol: http/protobuf
  sampler:
    name: parentbased_always_on
yaml
Note that selection happens here, in the platform team's configuration, not in the application's manifest. That single detail is what changes the adoption story. The DaemonSet needs host access to do its job: hostPID and hostNetwork, read-only RBAC for pod metadata, and a set of Linux capabilities. It does not need to be a privileged container:
securityContext:
  runAsUser: 0
  readOnlyRootFilesystem: true
  capabilities:
    drop: ['ALL']
    add:
      [
        'BPF',
        'PERFMON',
        'SYS_PTRACE',
        'NET_RAW',
        'NET_ADMIN',
        'SYS_ADMIN',
        'CHECKPOINT_RESTORE',
        'DAC_READ_SEARCH',
      ]
yaml
What works: tracing with no app change, no restart
No change to the application. The pod ran exactly as deployed. No init container, no injected environment variables, no annotations. A few seconds after OBI started, it logged that it had found a Node.js process, and spans started arriving.
No restart. I removed OBI with the application still running, then deployed it again. The same pod, never restarted, was traced within about 30 seconds. With an SDK agent this would have been a rollout of every service. Here the only thing that restarts is the OBI DaemonSet itself, when its own configuration changes.
Start scripts do not matter. The script overwrote NODE_OPTIONS, which, with the SDK, means no traces and no error. With eBPF there is nothing in NODE_OPTIONS to lose.
No fight with other operators. The strict reconciler stayed in sync the whole time. There was nothing to drift, because nothing on the Deployment changed.
Kubernetes context for free. Every span carried the service name, namespace, pod, deployment and node. Environment-wide labels were set once on the DaemonSet instead of once per service.
A cost worth knowing. In my test, OBI used about 250 MB of memory per node and well under 1% CPU. That number is likely to grow with the number of processes and the traffic it watches, so measure it on one real node before it goes on every node in the fleet.
Put together, this turns tracing from a request to every development team into a change the platform team makes on its own. That is the whole point.
The catch: one request, two traces
Then I looked at the traces themselves. Each /api/chain request should have been a single trace: the incoming request, the outgoing call to /api/hello, and the receiving side handling it. Instead, Jaeger showed two:
- one trace with the incoming
/api/chainrequest and the outgoing call to/api/hello, with nothing underneath it - a second, separate trace, starting at exactly the same moment, containing only the
/api/hellorequest being handled
Same call, seen from both sides, never linked. The calling side had not passed its trace ID along with the request, so the receiving side started a new trace. Every service was visible, but the thing that makes tracing distributed was missing.
OBI's start-up log explained it, and the explanation has nothing to do with Kubernetes or the application:
context propagation is disabled: the BPF compensation could not be loaded.
This kernel misreports ioctl(FIONREAD) for sockets in a sockhash ...
text
Here is the chain of cause, as far as I could untangle it:
- To link services, OBI writes a
traceparentheader into outgoing requests from inside the kernel, using an eBPF socket map. - Recent kernels, including stable releases and distribution kernels that backported the change, misreport how many bytes are waiting on sockets in that map. Applications that size their reads from that number could hang or truncate data.
- OBI corrects for it by writing the right value back into the application's memory, which needs an eBPF helper called
bpf_probe_write_user. - Kernel lockdown, which most distributions switch on automatically when Secure Boot is enabled, forbids exactly that helper. It exists to stop even root from tampering with other processes' memory.
- So OBI does the responsible thing and switches propagation off rather than risk breaking the application.
Turning Secure Boot off is not an answer I would give anyone running production, least of all in a regulated industry. Lockdown is there for good reasons.
And even on a node where propagation works, there is a second limit. According to the OBI documentation, over HTTPS the trace context only carries between services that OBI itself instruments, and proxies or L7 load balancers in the path can break it. If your services talk to each other over mTLS or through a service mesh, as many payment platforms do, check this too before you count on connected traces.
One more surprise while debugging: Node.js needed SYS_ADMIN for OBI to enter the pod's network namespace and set up Node.js support. The documentation mentions this capability for Go. Expect your security team to ask about it, together with NET_ADMIN and the host access.
How to check if your nodes support OBI context propagation
Whether you get connected traces is decided per node, by its kernel and its lockdown state. Before committing to eBPF tracing, run this on a node from each pool:
uname -r                            # does the kernel carry the FIONREAD change?
cat /sys/kernel/security/lockdown   # [none] lets OBI load its compensation
mokutil --sb-state                  # Secure Boot usually implies lockdown
bash
Then deploy the agent on one node and read its start-up log. If it says context propagation is disabled, you have your answer for that node pool, before anyone has built a plan around it.
OBI (eBPF) vs the OpenTelemetry SDK: which should you use?
After testing both, I do not see them as competitors. They solve different problems.
| SDK agent via the OTel Operator | eBPF (OBI) | |
|---|---|---|
| Who has to act | Each development team | The platform team alone |
| Change per service | Annotation and rollout | None |
| Start scripts, other operators | Need checking per service | Not affected |
| Connected traces across services | Yes | Depends on the node's kernel |
| HTTPS and service mesh between services | Yes | Only between eBPF-instrumented services; proxies and L7 load balancers can break it |
| Custom spans and business attributes | Yes | No |
| Visibility outside the app's own code | No | Network flows, unsupported languages, third-party binaries |
| Cost | Inside every application | One agent per node, with host access (about 250 MB of memory in my test) |
The pattern I would recommend is to use both. Start with eBPF to get every service on the map immediately, without asking anyone for anything. That alone answers a question nobody could answer before: which services talk to each other, where the latency is, which calls fail. Then, for the handful of services where end-to-end traces and business context really matter, add the SDK. By default, OBI skips processes that already run an OpenTelemetry SDK, so the two coexist.
And once developers can see their own services in Grafana without having lifted a finger, the conversation about adding the SDK gets much easier. In my experience, people are far more willing to improve a dashboard that already exists than to build one from nothing.
Conclusion
eBPF instrumentation changes who has to do the work. Tracing stops being a favour asked of every development team and becomes something the platform team can switch on by itself: no code, no annotations, no restarts, no interference with start scripts or operators.
What it does not change is physics. Linking services means touching network traffic from the kernel, and on hardened nodes the kernel may say no. Check your nodes first. If they pass, you may be able to get traces flowing across your whole platform in an afternoon. If they do not, eBPF still gives you every service on the map, and the SDK remains the way to connect the dots.
FAQs
Does eBPF tracing need code changes or a restart?
No. OBI runs as one DaemonSet per node and watches applications from the kernel, so there's no code change, no annotation and no application restart. Only the OBI DaemonSet itself restarts, when its own configuration changes.
Does eBPF distributed tracing work with Secure Boot / kernel lockdown?
Partly. Services are still traced, but on recent kernels with lockdown switched on (which Secure Boot usually does), OBI turns off context propagation, so each hop between services becomes a separate trace. Run cat /sys/kernel/security/lockdown on a node: [none] means OBI can link traces across services.
eBPF vs the OpenTelemetry SDK — which should I use?
Use both. Start with eBPF to get every service on the map without asking developers for anything, then add the SDK where you need traces you can rely on end to end, custom spans or business attributes. By default, OBI skips processes that already run an OpenTelemetry SDK, so the two coexist.
Does OBI propagate trace context over HTTPS or a service mesh?
Only partly. Over HTTPS, trace context only carries between services that OBI itself instruments, and proxies or L7 load balancers in the path can break it. If your services use mTLS or a service mesh, test it before you rely on connected traces.
What kernel does OBI need?
Linux kernel 5.8 or later, or 4.18 or later on RHEL-family distributions with eBPF backports. Whether traces connect across services also depends on the kernel's lockdown state: on recent kernels with lockdown on, OBI disables context propagation.