In today's highly competitive business landscape, every organization strives to be digital-first, necessitating a rapid pace of innovation to maintain a competitive edge. This has led to the frequent release of software features and new products becoming a common and essential practice. To keep up with this pace, some of the leading software engineering teams are deploying code changes to production multiple times a day. Each of these changes undergoes a continuous integration and deployment process, commonly referred to as CI/CD.
One of the most widely adopted tools for implementing CI/CD is Jenkins, an open-source automation tool that enables developers to build, test, and deploy their applications quickly and efficiently. Jenkins is highly customizable, with a vast array of plugins available to integrate various tools and technologies. This flexibility makes Jenkins an ideal choice for organizations of all sizes, from startups to large enterprises. As the centerpiece of the software development lifecycle, the way you utilize Jenkins has a significant impact on the success of your product or service.
Jenkins provides a rich set of features for managing and monitoring builds, including real-time notifications, detailed reports, and a user-friendly interface through a wide variety of plugins. For instance, one metrics plugin helps expose Jenkins metrics on a REST endpoint, allowing teams to easily track the progress of their builds and quickly identify and resolve any issues that may arise.
Comprehensive monitoring of Jenkins can help optimize your CI/CD pipeline and thereby improve key metrics for software delivery performance, such as deployment frequency and lead time for changes. In this article, we will explore how you can optimize software delivery by monitoring Jenkins using open-source observability products such as Prometheus and Grafana. But before delving into monitoring, let's discuss the Jenkins architecture and how it functions.
Jenkins Architecture Overview
In its simplest form, Jenkins can be deployed as a single node; however, this is not recommended for production environments. The diagram below illustrates the interaction between Jenkins and internal/external systems, along with the protocol used for communication:
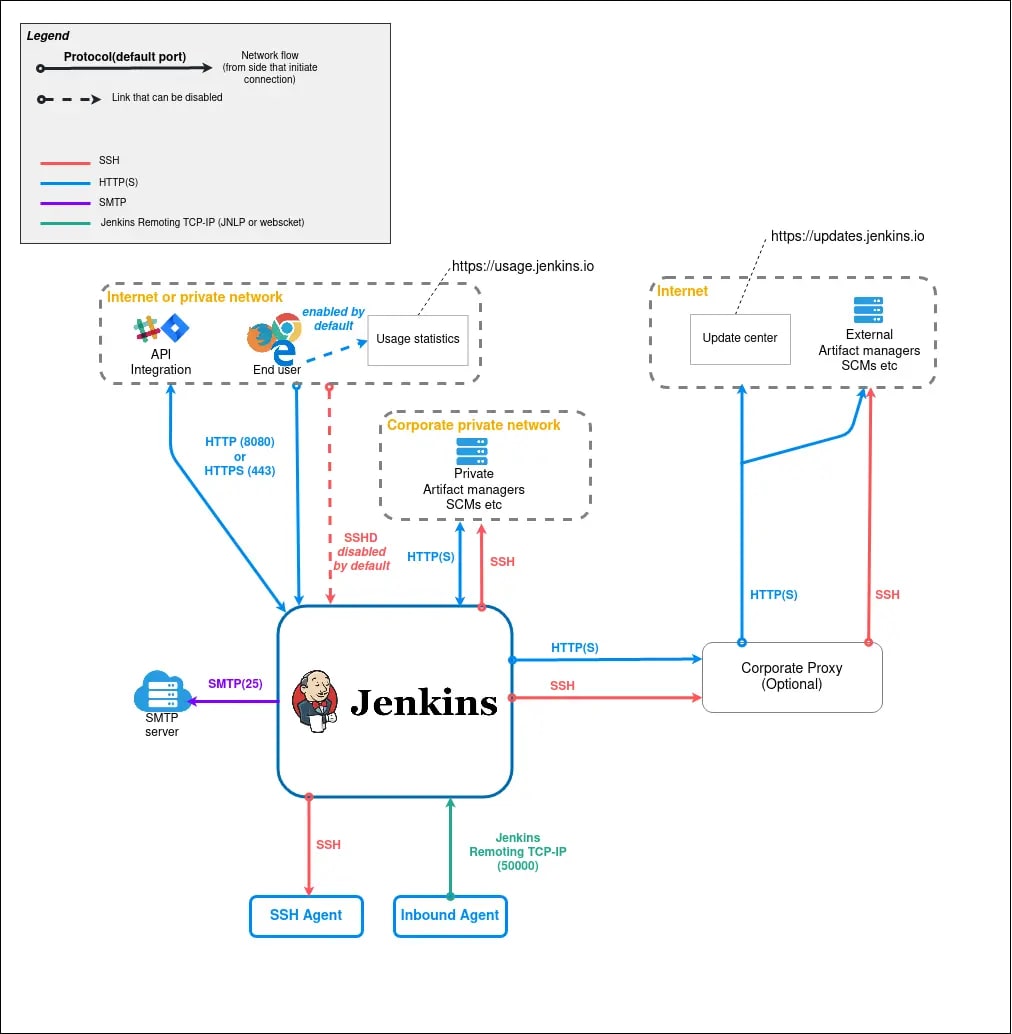
We can extend Jenkins by using extensions or plugins. Thus, the business layer is infinitely extensible, allowing for the deployment of a range of plugins readily available in the marketplace. You can also write and deploy your own plugin, while another option is to extend the storage layer:

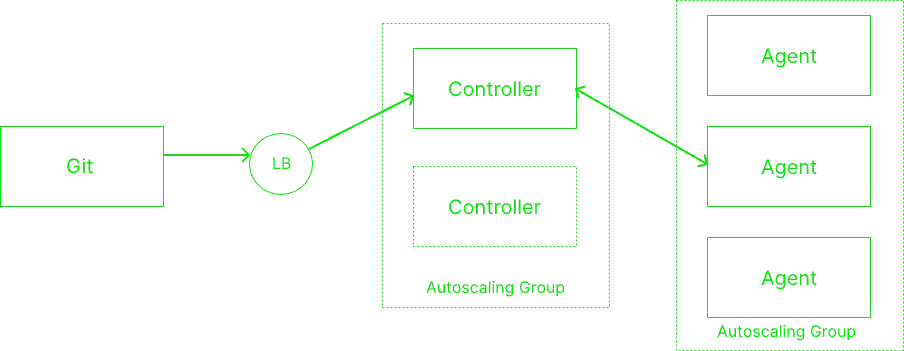
In a production environment, Jenkins is typically deployed in a master-slave configuration to enhance reliability and scalability. As shown in the diagram below, each of the Jenkins nodes is categorized into two roles: controller and agent. These roles are technically similar, but the controller is responsible for orchestrating and scheduling jobs on the agents, while the agents are the job executors and communicate with the controller. If the communication is broken, the agent is marked as unhealthy and removed from the cluster. These nodes can be deployed as physical or virtual machines, containers, or on Kubernetes:
Jenkins' Role in Software Development
Many software companies have embraced agile methodologies to improve their product development and go-to-market strategies. In fact, most top software teams have adopted the philosophy of continuous improvement, which has been shown to lead to 973x more frequent code deployments, 3x lower change failure rate, and 6570x faster incident recovery speed, according to Google's State of DevOps Report 2021. This approach allows these companies to quickly and effectively deliver high-quality products to their customers.
Within the context of continuous improvement, there are a couple of software delivery performance metrics—deployment frequency and lead time for changes—that are dependent upon the CI tool you choose. Slower pipelines and unreliable CI systems can degrade these key performance metrics. Thus, it makes sense to have good observability for CI to keep tabs on your organization's software delivery goals.
Monitoring Jenkins with Prometheus and Grafana
There are various methods—some proprietary and some open-source—for monitoring Jenkins nodes, metrics, and pipeline performance. In this article, we will focus on the popular open-source stack Prometheus and Grafana, which is often favored for the following reasons:
- Cost: Most open-source software is available for free or at a lower price, allowing for significant cost savings compared to proprietary solutions.
- Choice: Users are free to use the software in the way they want. If needed, you can customize the solutions as well.
- Collaboration: Because open-source software is built with the collaboration of various experts and resources from the global community, the end result is usually of high quality.
Before looking into what parameters and metrics you should consider in the monitoring scope, let's briefly review both Prometheus and Grafana.
Prometheus
Prometheus is a time-series database used to monitor the performance and availability of various systems and services. It typically scrapes (and also pushes) metrics from an endpoint continuously and stores the data points in a database. Its query interface, known as PromQL, interacts with the data, while an alert manager generates alerts on potential issues and integrates with various messaging systems.
Grafana
Grafana is an open-source visualization tool that can connect to various data sources, such as Prometheus, cloud, and databases. It allows you to set up dashboards for analyzing data, with a marketplace of dashboards to get you started, and it also features a helpful community.
Preparing the Monitoring Stack
To enable Jenkins to emit metrics for Prometheus to scrape, you need to install a couple of plugins, namely the Prometheus plugin and Metrics plugin. The Prometheus plugin will expose a REST endpoint at the /prometheus path. There are a few environment variables that are available to modify the settings:
- PROMETHEUS_NAMESPACE: Prefix of metric (Default: default)
- PROMETHEUS_ENDPOINT: REST Endpoint (Default: prometheus)
- COLLECTING_METRICS_PERIOD_IN_SECONDS: Async task period in seconds (Default: 120 seconds)
- COLLECT_DISK_USAGE: Set to "true" if you need to monitor disk usage and "false" if you are using cloud storage as a backend
Once the plugin is installed, restart the Jenkins service. After a couple of minutes, you should be able to verify the metrics being generated at the <JENKINS_URL>/prometheus endpoint.
To scrape the metrics from Jenkins into the Prometheus database, you need to add a scrape config in the Prometheus configuration file. An example of this is shown below, where the target is the Jenkins URL, and it is labeled with app: jenkins to easily identify the metrics coming from all Jenkins sources. Make sure the metrics_path in the configuration matches the PROMETHEUS_ENDPOINT environment variable. Then restart Prometheus to reflect the change.

To verify that metrics are being scraped properly, check the Prometheus targets (http://<PROMETHEUS_URL>/targets). If the state of the Jenkins endpoint is UP, then it is working:

Now, all the metrics are being captured in Prometheus, and it's time to visualize them for easier operations. For this purpose, we will deploy Grafana. Installing Grafana is pretty straightforward.
Once you have a Grafana instance running, you can then configure the Prometheus data source by visiting Configuration → Data Sources as the admin user:

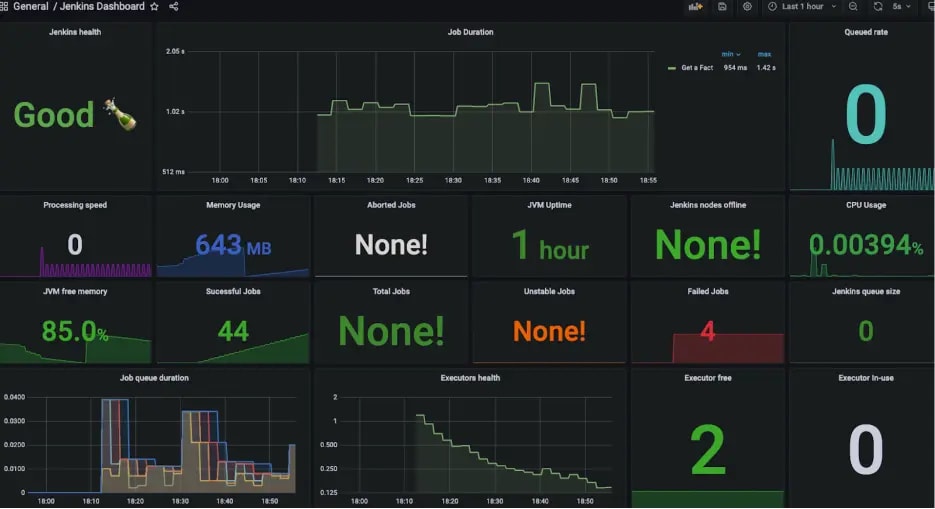
Important Metrics
The plugin emits a lot of metrics, but you do not need to worry about all of them. To simplify monitoring, let's break the metrics down into categories using Brendan Gregg's USE (Utilization Saturation and Errors) framework for monitoring. You first need to identify all of your resources; in the case of Jenkins, these would primarily be nodes (both controllers and agents), pipelines, and jobs.
Availability
The first item to monitor for any system is whether or not it is available. In the case of a high-availability scenario, you should prioritize monitoring how many nodes in the cluster are actually available for service; these nodes are known as "agents." Below are the key metrics for availability:
- Jenkins health check score: This is derived from the availability of the Jenkins system.
- JVM uptime: Jenkins is built on a JVM-based system, and its availability is dependent on the JVM running underneath.
- Nodes availability: The controller is responsible for coordinating jobs across agents, authentication, and reporting. It is also important to have a sufficient number of agents to reduce the job queue. In most elastic architectures, agent availability is not a concern because they are deployed on an autoscaling group.
- Free executors: A Jenkins executor is a component that enables a build to run on a node or agent. It can be thought of as a process running on the node.
Utilization
Another important category of metrics is resource utilization, which impacts the availability and performance of the system. If the utilization is too high, throttling or excessive garbage collection events may occur in the JVM. Some of the key metrics to keep an eye on include:
- JVM utilization (memory usage, thread states, and other JVM-specific metrics): The performance of Jenkins is dependent on the JVM. Watch out for heap usage, frequent blocking threads, and garbage collection duration; optimize this metric as required.
- Node utilization: This is not limited to important metrics such as CPU, memory, and disk space; it includes various other Linux/VM resources as well, e.g., the number of sockets running out on the node, etc.
- Executors in use: The number of executors in use can be benchmarked for both a period of good performance and when performance was not acceptable to get the right threshold for your specific deployment.
- Jobs: This includes performance metrics such as processing speed and the number of jobs running; the right threshold can be implemented for your specific deployment.
Saturation
When the job queue size becomes excessively long, new jobs will wait indefinitely to get an executor. This can lead to a poor experience for developers. The relevant metrics here are:
- Job queue size: This refers to the number of jobs waiting in line to be assigned to an executor. The longer the queue is, the slower the CI will be, so consider optimizing if this starts impacting productivity.
- Executor health: An indicator of the average job build time, this metric indicates jobs you might need to look into if it increases.
- Resource saturation of nodes: High saturation of key resources on the nodes can put the stability of your overall system at risk. This lets you know when you need to review the capacity of a cluster.
Errors
Failing to capture failures and investigate them will lead to wasting compute and time. It is important to set up an alert system in order to fix errors as soon as they occur. Two metrics are particularly relevant in this area:
- Failed jobs: A sudden increase in the number of failed jobs can indicate a potential issue with the node or configuration of the jobs, which could mean there are underlying issues you must address.
- Jenkins errors: Monitoring the log files of Jenkins can reveal issues; make sure to configure alerts for CRITICAL and ERROR events.
There are additional metrics captured by the plugin that are not discussed here; however, these are only useful in the case of advanced debugging and troubleshooting.
Alerting
Grafana has a built-in alerting mechanism, where you can create rules to get a notification on an event when the defined conditions are not being met. You should create alerting rules for all the critical metrics that cover the availability of your system, blocked jobs for a long period of time, and saturation of resources. There is no one solution that fits everyone’s alerting requirements. You can also implement various integrations with incident management and alerting systems like PagerDuty and Slack:
Key Takeaways
Jenkins is an open-source automation software that is widely implemented for CI, CD, and general automation. With its extensible architecture, you can configure it per your specific requirements; it also has more flexibility compared to other systems on the market.
Open-source software offers numerous advantages in achieving a cost-effective, transparent, and good-quality platform. We also looked into why monitoring is important to reduce noisy alerts and to keep an eye on software engineering KPIs for pipeline performance. An important takeaway is to configure actionable and clearly defined alerts. Combined with the Grafana and Prometheus stack, you can achieve good observability on Jenkins.
Reach out to us if you are looking for help with monitoring or setting up Jenkins.


