About the Client
Our client is a fast-growing quick service restaurant (QSR) chain operating across 100+ branches in India and the USA, with orders flowing primarily through Zomato and Swiggy delivery platforms. They are rapidly growing and expect to grow by 10x. At this scale, performance gaps that go undiagnosed become revenue problems quickly. Each branch generates dozens of performance signals daily, across a distributed operation that moves fast and leaves little room for delayed diagnosis. Business want to utilize the data and AI to make high quality decisions.
The Challenge
Like most businesses at early stage, the team relied on spreadsheet exports and reactive analysis — typically triggered only after issues had already become visible. By the time anyone understood why revenue had declined, the underlying cause had already compounded. Existing tools could tell you what changed (a branch down 12%, for instance) but not why. Not which stage of the funnel broke. Not what to do next. The gap between problem and diagnosis was measured in days, not minutes.
The goal was clear. Build a system that could continuously monitor every branch, identify root causes automatically, and close that gap entirely.
Our Approach
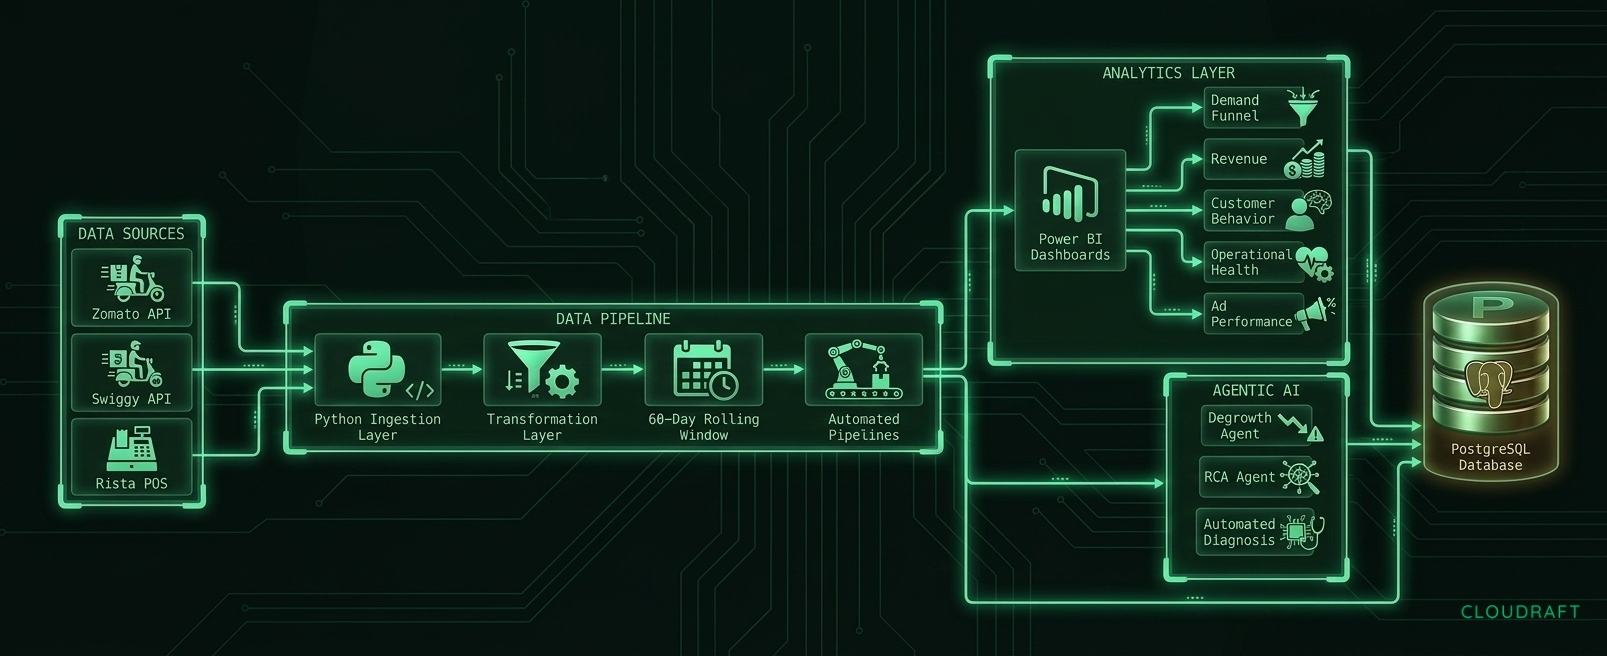 figure 1: Agentic AI data pipeline architecture for QSR branch performance monitoring
We started by working closely with the client's data analytics team — not to jump straight into building, but to understand how the business actually operated. Where did data live? How did it move? What decisions depended on it?
From there, we followed a deliberate sequence. First, we built a reliable data pipeline. Then we layered operational dashboards on top to solve some immediate visibility challenges the team was facing. Only once we had confidence in the data did we introduce AI agents to automate analysis and surface actionable insights. One of those agents is the Degrowth Agent — it detects dips in branch sales, identifies the underlying cause, and delivers recommendations directly to store managers and the strategy team.
The architecture itself is straightforward by design. A set of containers runs continuously through the day — executing scrapers and API calls to collect data from multiple sources — feeding an analytics layer with near real-time updates. This was a meaningful shift. Previously, the data the team was working with was up to two days old. Decisions were being made on stale context.
Getting the infrastructure right required solving a few non-trivial problems. Connecting via email and phone for OTP handling, routing through residential proxies to work around IP restrictions, and figuring out the right approach to data collection. We initially experimented with large action models for scraping in the early days, but the reliability wasn't where it needed to be. We moved to a hybrid approach — combining traditional scraping with direct API calls — which gave us the consistency and efficiency the pipeline required.
With the data layer stable and the operational dashboards in place, we turned our attention to the agents — automating the analysis work that had previously done manually.
Restaurant Data Pipeline: Integrating Zomato, Swiggy & POS Data
The client's operational data lives across three platforms marketplace data from Zomato and Swiggy, and POS transaction data from Rista. We created ingestion layer that pulls from all three using APIs and controlled scraping jobs. Raw data from each source lands in its own table in a centralised data store, where a transformation layer combines them into derived tables — a clean, branch-level view refreshed daily, with a lookback period that ensures late-arriving platform data is consistently reconciled.
This table maintains a rolling 60-day window of daily metrics for every branch, covering the full funnel from first touchpoint to final transaction:
- Demand funnel: impressions, menu opens, cart builds, order makes, orders placed
- Revenue: gross sales, AOV, organic sales, inorganic sales, potential revenue loss per day
- Customer behaviour: new user orders, repeat user orders, discount percentage
- Operational health: availability, page rating, percentage of days rating below 4, cancellations
- Ad performance: ads impressions, ads menu opens, ads orders, ads spend
Automated pipelines runs in parallel as per their schedules. Each runs the full sequence: ingestion, validation, cleaning, aggregation, and metric standardisation. Output feeds both the analytics layer and the agent system. On top of this, Power BI dashboards surface structured signals conversion drop-offs, visibility changes, rating deterioration, availability gaps, ad efficiency giving ops teams and branch managers a view of performance that used to take most of a working day in under five minutes.
But dashboards still require someone to interpret the patterns. That's where agentic automation was introduced.
AI Root Cause Analysis for Restaurant Revenue Degrowth
With clean data and a functioning analytics layer, the conditions were right to introduce agents. Not to replace the analytics layer, but to go further. Beyond surfacing what happened, to diagnosing exactly why it happened.
What is a Degrowth Agent?
The Degrowth Agent is an automated root cause analysis system that analyses every branch daily — tagging each as growing or degrowing, diagnosing the funnel breakpoints behind the trend, and delivering actionable insights.
Workflow
1. Detection
The system tracks how each branch is performing — this week against last, this month against last. Every branch is tagged as growing or degrowing, ranked by magnitude, and queued for deeper analysis.
2. Root Cause Analysis
This is where the system goes beyond reporting. The RCA agent maps the full demand funnel — Impressions → Menu Opens → Cart Builds → Orders → AOV → Gross Sales — and identifies exactly where leakage is occurring. It applies rule-based diagnostics and threshold logic to each branch independently, identifying the dominant drivers of revenue movement:
- Visibility loss due to impression decline
- Conversion drop due to pricing or discounts
- Demand suppression due to rating deterioration
- Order losses due to availability gaps
- Revenue decline driven by AOV compression
Instead of echoing percentage changes, the system pinpoints which stage of the funnel broke and why.
In simple terms, what this looks like in practice:
Branch: Pune. Revenue down 12% this month against last month.
The Degrowth Agent flags Pune as high-severity. The RCA agent identifies impressions down 18% and availability down 9% as the primary drivers — reduced platform visibility combined with a SKU-level stockout. The diagnosis lands with the Pune team the same morning. A more detailed data is available in the report sent via an email.
Impact of AI Agents
Before this system, understanding branch performance meant hours of spreadsheet work, manual root cause investigation, and operational issues that had already been compounded by the time anyone identified them.
Now, performance analysis runs automatically across 100+ branches every day. Root causes are identified in minutes, not days. The gap between something going wrong and someone knowing exactly why has collapsed and it keeps improving as more branches come online and the dataset grows.
Results: Automating QSR Branch Performance Monitoring with AI
A good business understanding of data, reliable data pipeline is key to making AI work. Once we had that, Analytics made the patterns visible. Agentic automation turned those patterns into daily action without anyone having to pull a report, run a query, or open a spreadsheet.
The result is an operation where the gap between something going wrong and someone knowing about it with context, with a reason, and with a recommended fix has collapsed from days to minutes.
As more branches come online, the system has more data to reason over and operation gets smarter over time.
Still Diagnosing Business Problems Manually?
Whatever your industry, if your team is spending hours pulling reports and chasing down root causes, there is a better way. Talk to us about structuring your operations data and deploying AI agents that do the analysis automatically.
