Observability isn’t optional and neither is Compliance
While talking about observability, there is something that often gets missed in conversations: it's compliance. We all know observability is essential. When you’re running any kind of modern application or infrastructure, having good visibility through logs, metrics, and traces is not just helpful, it’s how you keep systems stable, catch issues early, and move with confidence.
But while we’ve gotten better at collecting and analyzing the data, we haven’t always paid enough attention to what that data contains or where it ends up. These logs and data can easily include sensitive information. Things like user details, access tokens, or internal system behavior often get logged without much thought. And if that data is exposed or mishandled, it turns into a serious risk both legally and operationally.
In this blog post, I’ll walk you through how to build observability pipelines that are not only functional but also secure, compliant, and built with intention. We’ll look at how OpenTelemetry can help with that, and why its processors are one of the most effective ways to protect and control the flow of telemetry data.

What It Costs When Compliance Fails
We often think of compliance as just legal formalities or contracts. But when compliance fails, the consequences are real and can impact a business way more. Even a small oversight, like an email address showing up in a debug log or a trace, containing sensitive user data being sent to an external service without proper filtering, can become a much larger issue. These incidents do not just violate policies, they also break customer's trust, trigger audits, and can lead to financial and legal damage.
According to the IBM Cost of a Data Breach Report, the global average cost of a breach in 2024 was over 4.9 million dollars. In regulated industries such as healthcare, finance, and insurance, that number tends to be even higher. And the cost isn’t just about regulatory fines. A significant portion comes from the loss of business, system downtime, incident response, and long-term brand reputation issues. Even if your organization is not governed by strict regulations like GDPR, HIPAA, or PCI-DSS, your users still expect their data to be treated with care. Once trust is lost, it’s incredibly difficult to win back.
That is why compliance can’t be treated as something you can add later. It has to be built into the foundation, and that includes how we handle observability data. When telemetry pipelines are left unguarded, they can quietly become one of the biggest liabilities in your stack.
OpenTelemetry and Its Role in Data Protection
OpenTelemetry has quickly become the standard framework for collecting telemetry data across modern, distributed systems. It provides a consolidated approach to gathering logs, metrics, and traces and offers the flexibility to send that data to a variety of destinations, from observability platforms to self-hosted backends or data lakes.
While OpenTelemetry is excellent at solving how data is collected and transported, it places the responsibility for what data is captured and how securely it is handled entirely on the user. Its flexibility is a strength, but also a risk. OpenTelemetry will not automatically prevent sensitive data from flowing through your pipelines.
What Kind of Telemetry Data Needs Protection?
Before going into the protection strategies, let’s first identify the types of data that could pose compliance risks. Common examples include:
-
Personally Identifiable Information (PII): emails, phone numbers, user IDs
-
Sensitive system metadata: IP addresses, internal hostnames
-
Confidential business context: debug logs, internal environment tags
-
Regulatory-bound attributes: region identifiers (e.g., for GDPR)
If this data makes its way into your telemetry stream, it will continue through your system unless you explicitly configure rules to stop or modify it.
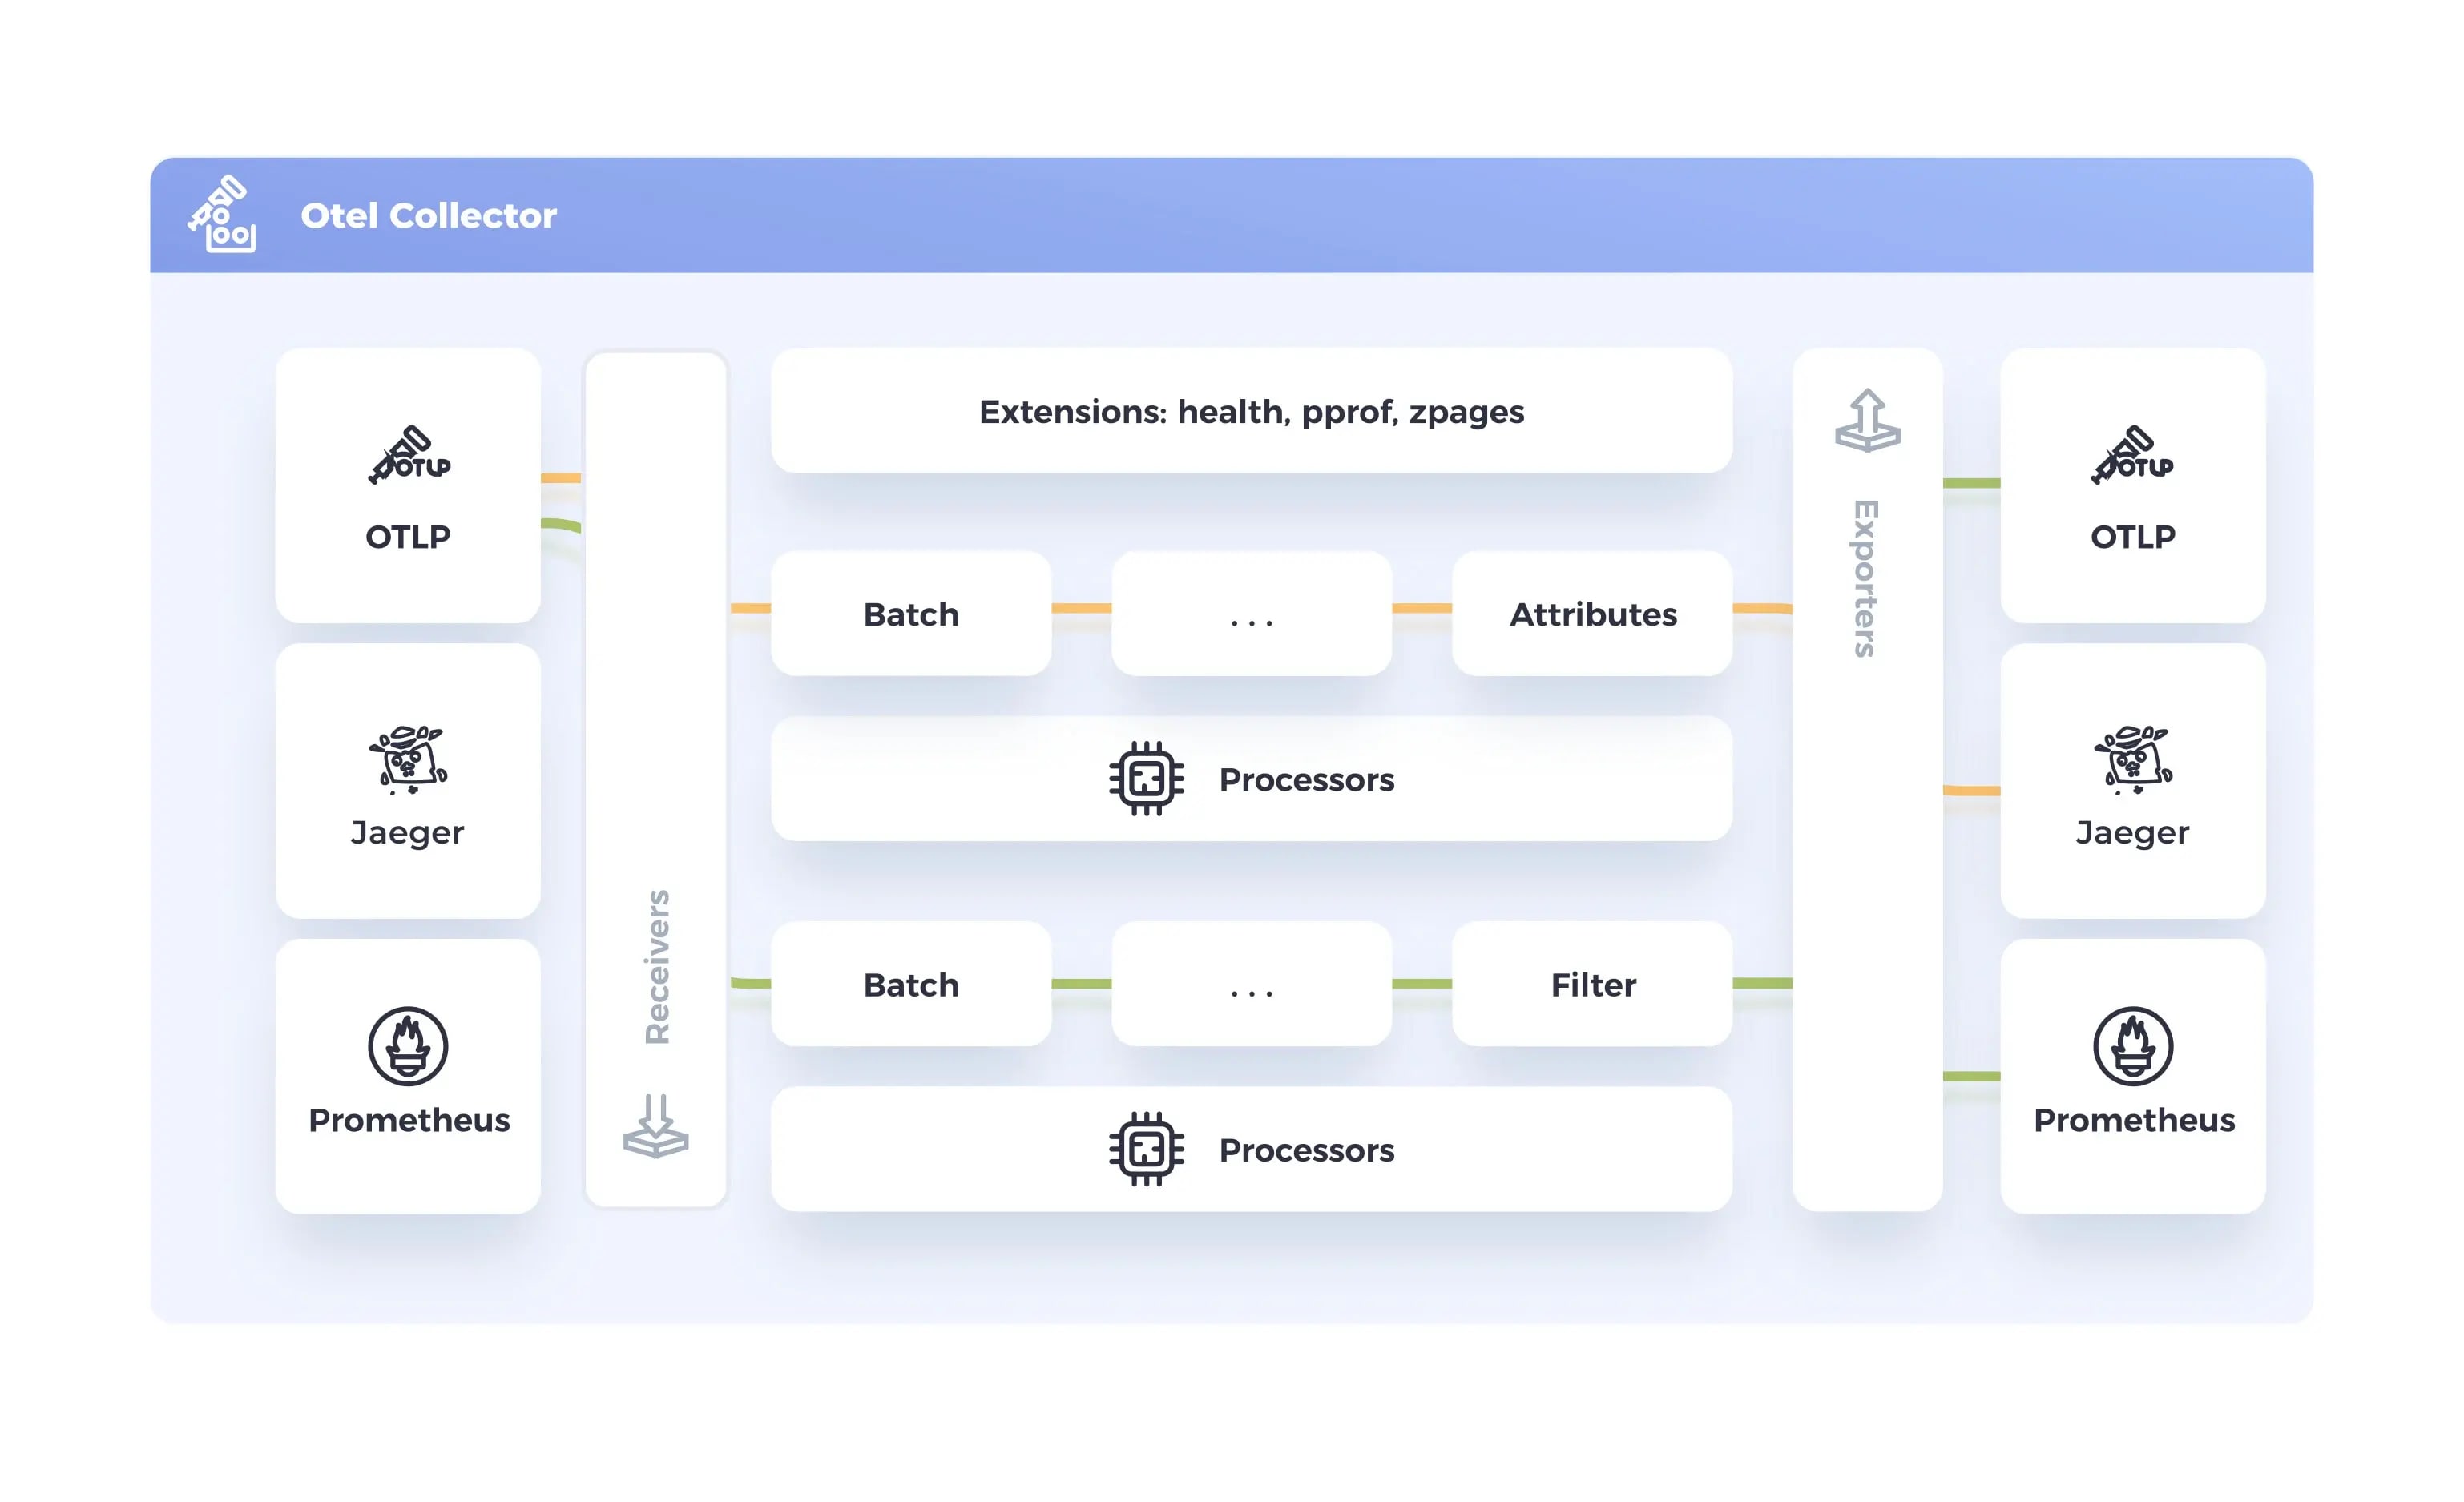
This is where the OpenTelemetry Collector becomes critical. Acting as the central hub between data sources and their destinations, the Collector offers a place where telemetry data can be inspected, filtered, transformed, or enriched before it moves any further. It is here that organizations gain control over what data stays, what data is modified, and what data never leaves the boundary at all.
With the right configurations, the Collector becomes more than just a routing tool. It becomes a guardrail for enforcing data protection standards, filtering out sensitive information, and helping ensure compliance with security and privacy requirements. OpenTelemetry, when used thoughtfully, is not just an observability solution. It is a foundational piece of your data protection strategy.

Solving Real Compliance Challenges with OpenTelemetry Processors
Processors are one of the most important functions within the OpenTelemetry Collector when it comes to enforcing data protection and compliance. Positioned between data collection and export, they serve as the transformation and control layer where critical compliance logic can be applied before telemetry leaves your environment.
Learn how to design observability pipelines that enforce data protection, support compliance regulations, and ensure secure telemetry using OpenTelemetryThe strength of processors lies in their flexibility. They allow you to redact, suppress, enrich, or reshape telemetry based on your organization's security and privacy requirements. This feature is essential when dealing with sensitive or regulated data flowing through your observability systems.
Here are some of the practical ways processors help us address real-world compliance concerns:
Redacting Sensitive Information Logs and traces often contain personal or confidential data such as email addresses, user IDs, or access tokens. Processors like attributesprocessor or transformprocessor can be configured to remove or make these values anonymous automatically, helping prevent unintentional exposure.
Filtering Non-Compliant Data Telemetry that includes content that violates policies can be filtered out entirely before reaching any downstream systems. This helps reduce risk and ensures that observability does not become a liability.
Enforcing Data Residency and Routing Rules For organizations subject to regional data protection laws, processors can route or drop telemetry based on attributes such as geography or service type. This ensures that data remains within defined boundaries and complies with jurisdictional requirements.
Normalizing and Structuring Telemetry for Audits Compliance often requires structured, consistent data. Processors can standardize field names, values, and formats so that logs, metrics, and traces align with internal audit and reporting standards.
Reducing Noise to Highlight What Matters Not all telemetry is useful, and excessive data can obscure important signals. Processors help reduce noise by removing redundant spans or unnecessary attributes, making it easier to focus on meaningful insights while keeping compliance in check.
By configuring processors with intent to be compliant, organizations can ensure that observability pipelines are secure, responsible, and aligned with compliance goals. This control layer not only supports regulatory requirements but also promotes better data and operational clarity. When designed properly, processors become more than just a technical feature, they can represent a proactive step toward secure and compliant observability.
Practical Examples of Compliance-first Telemetry Pipelines
After exploring the role of processors in enforcing compliance, let’s look at how to bring it all together in real-world telemetry pipelines. Building compliance-first observability is not just about theory; it is about designing workflows that consistently protect data across environments.
List of Processors in OpenTelemetry Collector
The OpenTelemetry Collector provides several processors out of the box. The most commonly used ones for compliance are:
-
attributesprocessor – Add, remove, update, or redact specific attributes
-
filterprocessor – Filter spans or logs based on matching criteria
-
routingprocessor – Route telemetry conditionally based on resource or attribute values
-
transformprocessor – Use expressions to rename, update, or drop fields
How to Choose the Right Processor
We can use the specific processors for doing the job based on various use cases, like:
| Use Case | Processor |
|---|---|
| Remove or redact sensitive fields | attributesprocessor |
| Drop unnecessary or risky logs/spans | filterprocessor |
| Route telemetry based on geography or team | routingprocessor |
| Normalize field names for audit compliance | transformprocessor |
Example 1: Redacting PII in application traces
In many applications, traces can unintentionally carry personally identifiable information like user email addresses or phone numbers. To address this, you can build a pipeline that begins with the otlp receiver, processes the trace data through an attributesprocessor configured to detect and redact sensitive fields such as user.email or user.phone, and finally exports it to a tracing backend like Jaeger or another OTLP-compatible service. Example Config:
receivers:
  otlp:
    protocols:
      grpc:
      http:

processors:
  attributes/pii_redaction:
    actions:
      - key: user.email
        action: delete
      - key: user.phone
        action: delete

exporters:
  jaeger:
    endpoint: 'http://jaeger-collector:14250'
    tls:
      insecure: true

service:
  pipelines:
    traces:
      receivers: [otlp]
      processors: [attributes/pii_redaction]
      exporters: [jaeger]
yaml
Outcome:
This pipeline deletes any attribute named user.email or user.phone before data is exported to Jaeger, ensuring no PII leaves the pipeline. With this setup, you preserve the diagnostic value of the trace without risking exposure of personal data. This approach helps maintain user privacy and stay aligned with data protection policies.
Example 2: Filtering internal debug logs in production
Developers often include verbose debug logs during development, but these logs are rarely suitable for production. In a compliance-first pipeline, you can start with a filelog or fluentforward receiver and pass the logs through a filterprocessor that drops entries where severity is set to "DEBUG" or the environment tag indicates it's development-only. The cleaned logs are then sent to a system like Google Cloud Logging or Datadog.
Example Config:
receivers:
  filelog:
    include: ['/var/log/app/*.log']

processors:
  filter/drop_debug_logs:
    logs:
      log_record:
        - severity_text: 'DEBUG'

exporters:
  googlecloud:
    project: my-production-project

service:
  pipelines:
    logs:
      receivers: [filelog]
      processors: [filter/drop_debug_logs]
      exporters: [googlecloud]
yaml
Outcome:
This ensures that only production-relevant and compliant log data is exported, reducing both operational risk and unnecessary storage or processing costs.
Example 3: Ensuring data residency compliance
Let’s say your organization collects telemetry from EU-based services and must comply with regional data residency laws. The pipeline begins with the otlp receiver and uses a routingprocessor to inspect attributes like region = eu-west1. Based on this, telemetry is selectively routed to an EU-based backend only.
Example Config:
receivers:
  otlp:
    protocols:
      grpc:
      http:

processors:
  routing/data_residency:
    table:
      - value: eu-west1
        exporters: [eu_backend]
        statement: match(resource.attributes["region"], "eu-west1")
      - value: default
        exporters: [non_eu_backend]

exporters:
  eu_backend:
    endpoint: 'eu-collector.mycompany.com'
  non_eu_backend:
    endpoint: 'us-collector.mycompany.com'

service:
  pipelines:
    traces:
      receivers: [otlp]
      processors: [routing/data_residency]
      exporters: []
yaml
Outcome:
EU data is routed exclusively to EU-compliant systems, supporting regional legal obligations. This architecture ensures that regulated data never leaves its permitted geographic boundary, keeping your observability setup aligned with legal and contractual obligations.
Example 4: Standardizing attributes for compliance audits
In regulated industries, audit requirements often demand consistent telemetry formats. A compliance-aligned pipeline might start with receivers like prometheus, otlp, or filelog, and pass the data through a transformprocessor that renames fields. For instance, user_id becomes user.id, and txn_amount becomes transaction.amount. The processed data is then exported to a SIEM system or centralized log storage for long-term analysis. This kind of field normalization supports auditability and ensures that all downstream systems operate with uniform telemetry schemas, improving clarity and compliance readiness.
Example Config:
receivers:
  otlp:
    protocols:
      grpc:
      http:

processors:
  transform/standardize_fields:
    trace_statements:
      - context: span
        statements:
          - rename(attributes["user_id"], "user.id")
          - rename(attributes["txn_amount"], "transaction.amount")

exporters:
  logging:
    loglevel: debug

service:
  pipelines:
    traces:
      receivers: [otlp]
      processors: [transform/standardize_fields]
      exporters: [logging]
yaml
Outcome: With consistent attribute names, you improve audit readiness and make logs easier to correlate.
These examples show how easy it is to tailor your observability pipeline for compliance without sacrificing performance or visibility. By using the Collector as a policy engine, you ensure that compliance checks are built into your telemetry flow.
Designing a Secure and Compliant Observability Architecture
By now, it’s clear that securing telemetry data is not just about selecting the right tools. It involves designing the entire observability architecture with compliance in mind from the very beginning.
To do this effectively, observability should be treated as a data supply chain. Each stage, starting from ingestion to processing to export, must actively enforce protections, not just transfer data passively.
Centralize Control
The OpenTelemetry Collector sits at the center of a secure observability setup. It serves as the control point for managing ingestion, sanitation, transformation, routing, and export. This enables consistent enforcement of policies, regardless of where the data originates. If you need to redact PII before logs leave a Kubernetes cluster, route metrics from the EU to region-specific storage, or standardize trace data for audit readiness, the Collector is where those rules are applied.
As observability grows, managing multiple Collector instances across environments can become complex. To help us manage this situation we can implement the Open Agent Management Protocol (OpAMP). OpAMP provides a standardized way to remotely manage OpenTelemetry Collectors at scale. It enables you to push configuration updates, monitor agent health, and enforce policy changes without logging into each node manually. It’s an essential addition for teams aiming to maintain observability governance while reducing operational overhead.
Keep Processing and Export Logic Outside Application Code
A frequent mistake is embedding telemetry logic directly within application code. This introduces risk, increases complexity, and makes enforcement inconsistent across services. A more secure approach moves that logic into centrally managed Collector configurations. This allows teams to update rules without deploying new code and gives compliance teams the ability to audit pipelines independently.
Encrypt Telemetry in Transit and at Rest
All telemetry data, including logs, metrics, and traces, should be encrypted while in transit and when stored. Use TLS to secure communication between agents and Collectors, and ensure encryption at rest is enabled in your observability backends such as OpenSearch, Datadog, or GCP.
Avoid Overcollection and Excessive Retention
Collecting or retaining more data than necessary increases your risk exposure. Implement filtering at the source and within the Collector to discard irrelevant data. Align retention policies with legal and compliance requirements to ensure that sensitive data is not kept longer than necessary.
Enforce Separation of Duties
Not every team member needs access to all telemetry. Design the system to enforce access controls, both through infrastructure-level mechanisms like IAM or RBAC and within observability platforms using scoped dashboards or tenant-aware indexing. This limits access, reduces internal risk, and simplifies compliance audits.
Additional Layers of Data Protection Beyond Processors
While OpenTelemetry processors play a critical role in securing and shaping telemetry data, they should be part of a broader data protection strategy. Ensuring compliance requires a layered approach that includes infrastructure-level security, backend configurations, and organizational access controls.
Below are key layers that complement the processor-level protections:
1. End-to-End Encryption
Encryption must be enforced at every stage of telemetry flow. Use TLS for all communication between agents, collectors, and backend systems. Whether data is being transmitted over gRPC or HTTP, encrypted channels prevent interception and unauthorized access during transit.
2. Secure and Compliant Backends
After data is processed, it is stored or analyzed in backends such as OpenSearch, Google Cloud Logging, or Datadog. These systems must be configured to encrypt data at rest and enforce strict access controls. Ensure that backend permissions align with your organization's compliance policies.
3. Role-Based Access Control (RBAC) and Principle of Least Privilege
Limit access to telemetry data and configuration files using IAM or RBAC mechanisms. Each user or team should have access only to the data necessary for their responsibilities. This reduces the risk of accidental exposure and simplifies audit processes.
4. Protected Configuration Management
Treat OpenTelemetry configuration files as sensitive assets. Store them in secure, version-controlled repositories with restricted access. Use secrets management tools like HashiCorp Vault or GCP Secret Manager to inject credentials and tokens securely, instead of embedding them in plaintext within configuration files.
5. Routine Compliance Reviews and Audits
Security and compliance are ongoing responsibilities. Schedule periodic reviews of telemetry pipelines, access controls, and retention policies. Auditing configurations and data flows regularly helps identify outdated settings, over-permissive access, or unintentional data leakage.
6. Data Minimization Principles
Collect only what is necessary. Overcollection not only adds noise but also increases the surface area for compliance risk. Apply filters early in the pipeline, remove legacy or redundant telemetry sources, and periodically reassess what is being collected across environments.
Build Trust Into Your Observability Stack
Observability has come a long way, and today, building trust into it begins with intentional design. From deciding what to collect to how data is handled, OpenTelemetry offers the flexibility and control needed to embed security and compliance into every stage of the pipeline. By shaping telemetry as it flows, you enable teams to maintain visibility while reducing risk. I hope this article provides you with practical guidance to create observability pipelines that are not just effective, but also secure and compliant by design.
Looking for Observability Experts?
Let our experts help you build trust into your observability stack and ensure compliance with regulatory requirements.


